3 Revenue Management Measurement

Competencies

  1. Analyze Average Daily Rate (ADR), Occupancy (OCC), and Revenue per Available Room (RevPAR).
  2. Examine Competitive Set, Market share, and Index
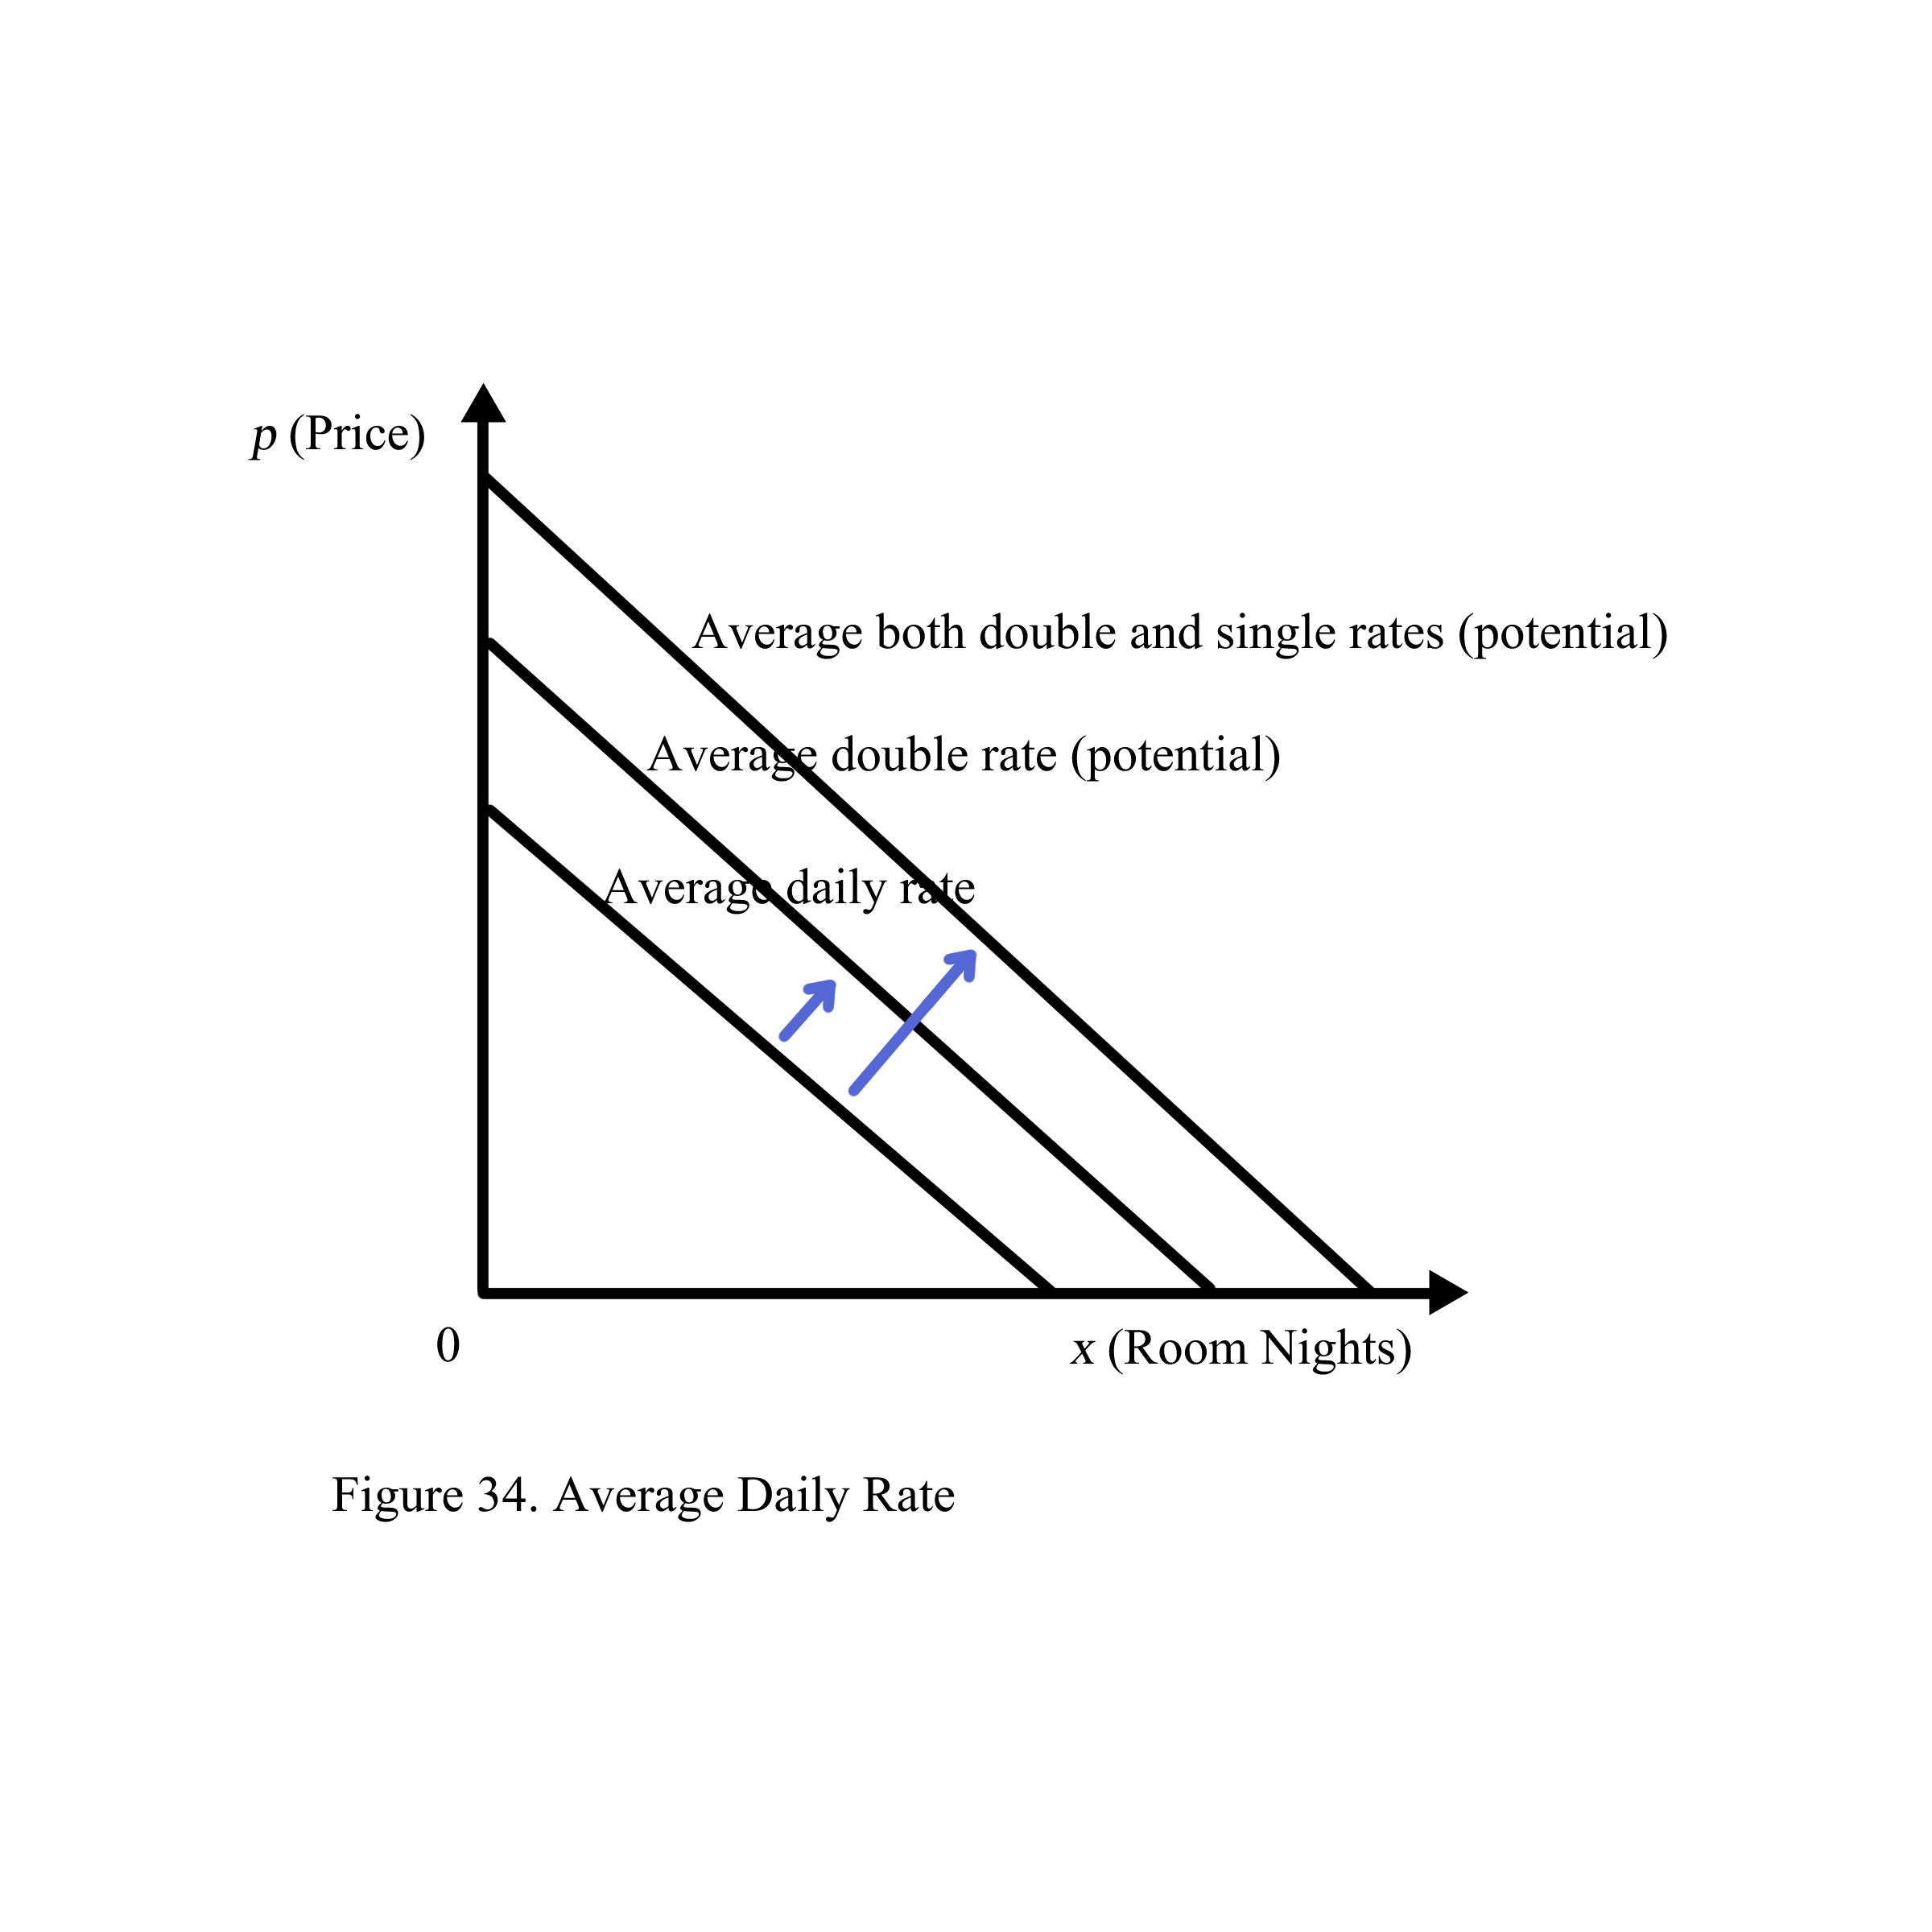
  3. Measure Yield indices: Potential Average Double Rate and Potential Average Double and Single Rate.

Chapter 2 Outlines

1. ADR and RevPAR in Y axis and OCC in X axis.

2. Revenue as two integrals: ADR vs. Demand and RevPAR vs. Supply

3. Yield as an integral of ADR and OCC


This chapter provides an in-depth analysis of six key variables essential to revenue management: Demand, Supply, Revenue, Average Daily Rate (ADR), Revenue Per Available Room (RevPAR), and Occupancy. These variables form the backbone of effective pricing strategies and financial performance in the hospitality industry. The chapter also explores the dual challenge of maximizing revenue while navigating various constraints that impact these variables.

Demand

Demand refers to the desire and willingness of consumers to purchase hotel rooms at different price points. It represents the total number of room nights sold in a hotel. Understanding demand patterns is crucial, as they fluctuate based on factors such as seasonality, economic conditions, and consumer preferences. Accurately forecasting demand allows hoteliers to optimize pricing strategies, ensuring that they can capture maximum revenue during high-demand periods while avoiding revenue loss during low-demand times.

Supply

Supply represents the total number of rooms available for sale in a hotel. This variable is relatively fixed in the short term, as it depends on the hotel’s capacity. However, supply can be adjusted in the long term through strategic decisions such as renovations, expansions, or changes in room availability. Balancing supply with demand is critical for optimizing occupancy rates and ensuring that the hotel operates at peak efficiency.

Revenue

Revenue is the total income generated from selling hotel rooms, and it is the ultimate measure of a hotel’s financial success. Revenue management strategies aim to maximize this figure by adjusting prices, managing inventory, and optimizing sales channels. By analyzing revenue based on other key variables, hoteliers can identify areas for improvement and develop strategies to enhance overall profitability.

Average Daily Rate (ADR)

ADR is a key performance indicator that represents the average revenue earned per occupied room. It is calculated by dividing total room revenue by the number of rooms sold. ADR is a critical metric for understanding how well a hotel is performing in terms of pricing. A higher ADR indicates that the hotel is successfully charging premium rates, while a lower ADR may suggest the need for price adjustments or promotional strategies to boost revenue. It is calculated by dividing the total room revenue by the number of rooms sold. ADR serves as a key indicator of a hotel’s pricing strategy and market positioning. A higher ADR suggests that the hotel can command premium rates, often due to factors like location, amenities, brand reputation, and demand. However, a high ADR alone does not guarantee overall profitability, as it needs to be balanced with occupancy rates to ensure maximum revenue generation.

Revenue Per Available Room (RevPAR)

RevPAR is another essential performance metric that combines occupancy and ADR to provide a comprehensive view of a hotel’s revenue-generating capability. It is calculated by multiplying ADR by the occupancy rate or by dividing total room revenue by the total number of available rooms. RevPAR is often considered the most important indicator of a hotel’s financial health, as it reflects both pricing strategy and occupancy efficiency. A strong RevPAR indicates that the hotel is effectively balancing room rates and occupancy to maximize revenue. It provides a more accurate picture of financial performance than either ADR or occupancy alone.

Occupancy

Occupancy measures the percentage of available rooms that are sold over a given period. It is a vital indicator of demand and is closely linked to both ADR and RevPAR. High occupancy rates suggest strong demand, while low occupancy may indicate the need for adjustments in pricing, marketing, or sales strategies. Understanding occupancy trends helps hoteliers make informed decisions about pricing, inventory management, and promotional activities. Occupancy rates provide insights into how well a hotel is attracting guests, and high occupancy often indicates strong demand, effective marketing, and competitive pricing. However, a focus on occupancy alone without considering ADR may lead to a decrease in revenue, as selling rooms at lower rates just to boost occupancy can reduce overall profitability.

The Dual Challenge: Maximization and Constraints

This chapter also addresses the dual challenge of maximization and constraints, which is central to revenue management. On one hand, the goal is to maximize revenue by optimizing the key variables—demand, supply, revenue, ADR, RevPAR, and occupancy. On the other hand, various constraints must be considered, including both internal and external factors.

Understanding these constraints is crucial for effective revenue management, as they shape the strategies and decisions made to optimize revenue.

Internal Constraints include limitations within the organization, such as room capacity, budgetary restrictions, technological capabilities, and data accuracy. These constraints require careful management to ensure that revenue is maximized without overextending resources or compromising service quality.

Internal Constraints originate from within the organization and encompass a range of limitations:

Capacity Limitations: These refer to the maximum supply available, such as the total number of rooms and the number of nights they can be sold (measured in room nights).
Financial Constraints: These involve budgetary limitations that affect pricing strategies and investment in resources.
Technological Constraints: These refer to the limitations of the revenue management system, which may affect the ability to forecast demand or adjust prices dynamically.
Data Accuracy: The reliability of data used for forecasting and decision-making is crucial, as inaccuracies can lead to suboptimal pricing strategies.
Strategic Constraints: These include the influence of brand positioning and corporate policies on pricing and inventory decisions.

External Constraints encompass factors outside the organization’s control, such as competition, market demand, economic conditions, and regulatory environments. Navigating these constraints requires a strategic approach to pricing, inventory management, and market positioning.

External Constraints are factors outside the organization that impact revenue management strategies:

Competitive Landscape: This involves the actions and strategies of competing hotels, often analyzed through the competitive set (comp set) concept, which compares hotels with similar characteristics.
Market Demand: Feedback from the market, including customer preferences and seasonal fluctuations, can impact pricing decisions.
Economic Cycles: Factors like inflation rates and tax regulations play a significant role in shaping pricing strategies.
Industry Innovations: Technological advancements and new industry practices can influence how revenue management is executed.
Societal Trends: Changing consumer behaviors and preferences also act as external constraints that need to be considered.

Examining Competitive Set, Market Share, and Index

Competitive Set (Comp Set) refers to a group of hotels that are considered direct competitors based on factors such as location, amenities, brand positioning, and target market. Analyzing the competitive set is essential for benchmarking a hotel’s performance against its peers. By understanding how competitors are performing in terms of ADR, occupancy, and RevPAR, a hotel can adjust its strategies to remain competitive. The competitive set also helps in identifying market trends, understanding pricing dynamics, and gauging the effectiveness of marketing and sales efforts. Competitive Set refers to the group of hotels that compete with each other based on similarities in location, amenities, and brand. These hotels often adopt different strategies to outperform each other. The competitive set can be analyzed through two key dimensions:

Pricing Based on Tangibles:
Location (Figure 30): The location of a hotel is a key determinant of its competitive position. If two hotels are situated in the same area, they are likely competing for the same market share. For example, if Hotel A and Hotel B are both located in City Z, they are direct competitors vying for dominance in that market.
Amenities (Figure 30): The presence of similar amenities, such as the same brand of toiletries, mattresses, or in-room technology, indicates that the hotels are competing on the basis of physical offerings. Hotels with similar amenities often compete for the same customer base.

Competitive set simply means different hotel companies use different strategies to overcome the other brands. You can notice this by two similarities: location, amenities, and brand.


Pricing Based on Intangibles:
Brand Affiliation (Figure 31): Brand affiliation plays a significant role in pricing strategies. Different hotels with varying brand recognition may set different prices. For example, an established, well-known hotel brand may charge higher prices compared to a newer, lesser-known brand, even if both are located in the same area.

Market Share represents the proportion of total market revenue or room nights that a hotel captures relative to its competitive set. Market share is a critical metric for understanding a hotel’s position within its market. A high market share indicates that the hotel is effectively attracting a significant portion of the available demand, while a low market share may signal the need for strategic adjustments in pricing, marketing, or service offerings. Monitoring market share over time helps hotels identify shifts in competitive dynamics and respond proactively to changes in market conditions (Figure 32).
Market share represents the proportion of the total market that a hotel captures. Smaller hotels typically secure a smaller market share, while larger, more established hotels capture a larger portion of the market. For example, a luxury hotel may dominate the market, attracting more high-spending customers, while a budget hotel captures a smaller segment of price-sensitive travelers. Market share is simply the fraction of one group of consumers who enter one smaller hotel compared to a more luxurious hotel. Smaller companies will inevitably get a smaller portion of the group, and larger companies will get a much larger portion.


Market Index (Figure 33): The market index is calculated as the ratio of the total revenue earned by a wealthier company to that earned by a smaller competitor. For instance, if Company A generates $300 in revenue per week, and Company B generates $200, the market index would be 1.5, indicating that Company A has a stronger market presence relative to Company B.

Index metrics, such as RevPAR Index, ADR Index, and Occupancy Index, provide a comparative measure of a hotel’s performance relative to its competitive set. An index score of 100 indicates that the hotel is performing on par with its competitors. A score above 100 suggests that the hotel is outperforming its competitive set, while a score below 100 indicates underperformance. These indices are valuable tools for assessing a hotel’s relative success and for identifying areas where improvement may be needed. They allow hoteliers to track their competitive position over time and make data-driven decisions to enhance their market standing.

These insights into constraints, competitive dynamics, and market metrics are crucial for developing effective revenue management strategies that maximize revenue while navigating the complexities of the hospitality industry.

The Average Daily Rate (ADR) is a key metric in hotel revenue management that represents the average price per room per night. To calculate ADR, you divide the total room revenue for a given period by the number of room nights sold during that same period. Additionally, to gauge performance, hotels use a concept called ADR potential. This is the ADR you would achieve if all room types sold were priced at the rack rate. Refer to Figure 34 for a visual representation.

Measuring Yield Indices: Potential Average Double Rate and Potential Average Double and Single Rate

Yield indices are critical metrics used to assess a hotel’s revenue management effectiveness by comparing actual revenue to potential revenue. These indices provide insights into how well a hotel is capitalizing on its revenue opportunities, particularly in terms of pricing and room type allocation.

Potential Average Double Rate refers to the hypothetical average rate a hotel could achieve if all double occupancy rooms were sold at their highest possible rate. This rate assumes optimal pricing strategies and full occupancy of double rooms at premium prices. By comparing the actual average double rate to the potential average double rate, a hotel can assess how well it is utilizing its double room inventory. A lower actual rate compared to the potential rate may indicate underpricing or a need for better demand management to capture higher rates.

Potential Average Double and Single Rate is a broader measure that considers the combined potential revenue from both double and single occupancy rooms. This metric assumes that all rooms, whether double or single, are sold at their maximum possible rates. It provides a comprehensive view of the hotel’s potential revenue across different room types. By analyzing the gap between the actual rates achieved and the potential rates, hotels can identify opportunities for improving pricing strategies, optimizing room type allocation, and enhancing overall yield management.

Yield indices such as these are vital for understanding the effectiveness of a hotel’s revenue management practices. They help hoteliers identify pricing inefficiencies, optimize room inventory, and develop strategies to increase revenue. By regularly measuring and analyzing these indices, hotels can fine-tune their operations to achieve their full revenue potential, ensuring they are not leaving money on the table in a competitive market environment.

For a total revenue of $900 over 4 room nights, the Average Daily Rate (ADR) is calculated as follows: $900 divided by 4 room nights equals $225 per night. This revenue includes a luxury suite sold on Day 1 for $400, a suite sold on Day 2 for $300, a Double Queen room sold on Day 3 for $200, and a Single King room sold on Day 4 for $100.

Each room type has the potential for an additional $50 charge for an extra guest, but this potential is not included in the ADR calculation, which only accounts for realized revenue. If each room had sold for an additional $50, the ADR would have been $300. This means you realized 83.3% of your potential revenue (see Figure 35).


Occupancy is defined as the percentage of room nights sold relative to the number of room nights available, representing the ratio between realized demand and supply (see Figure 36).


In the example shown, five rectangles represent five room nights (either 5 rooms for 1 night each or 1 room for 5 nights), indicating a total supply of 5 room nights regardless of pricing. If the hotel sold 3 of these room nights, the occupancy rate would be 60% (3/5).

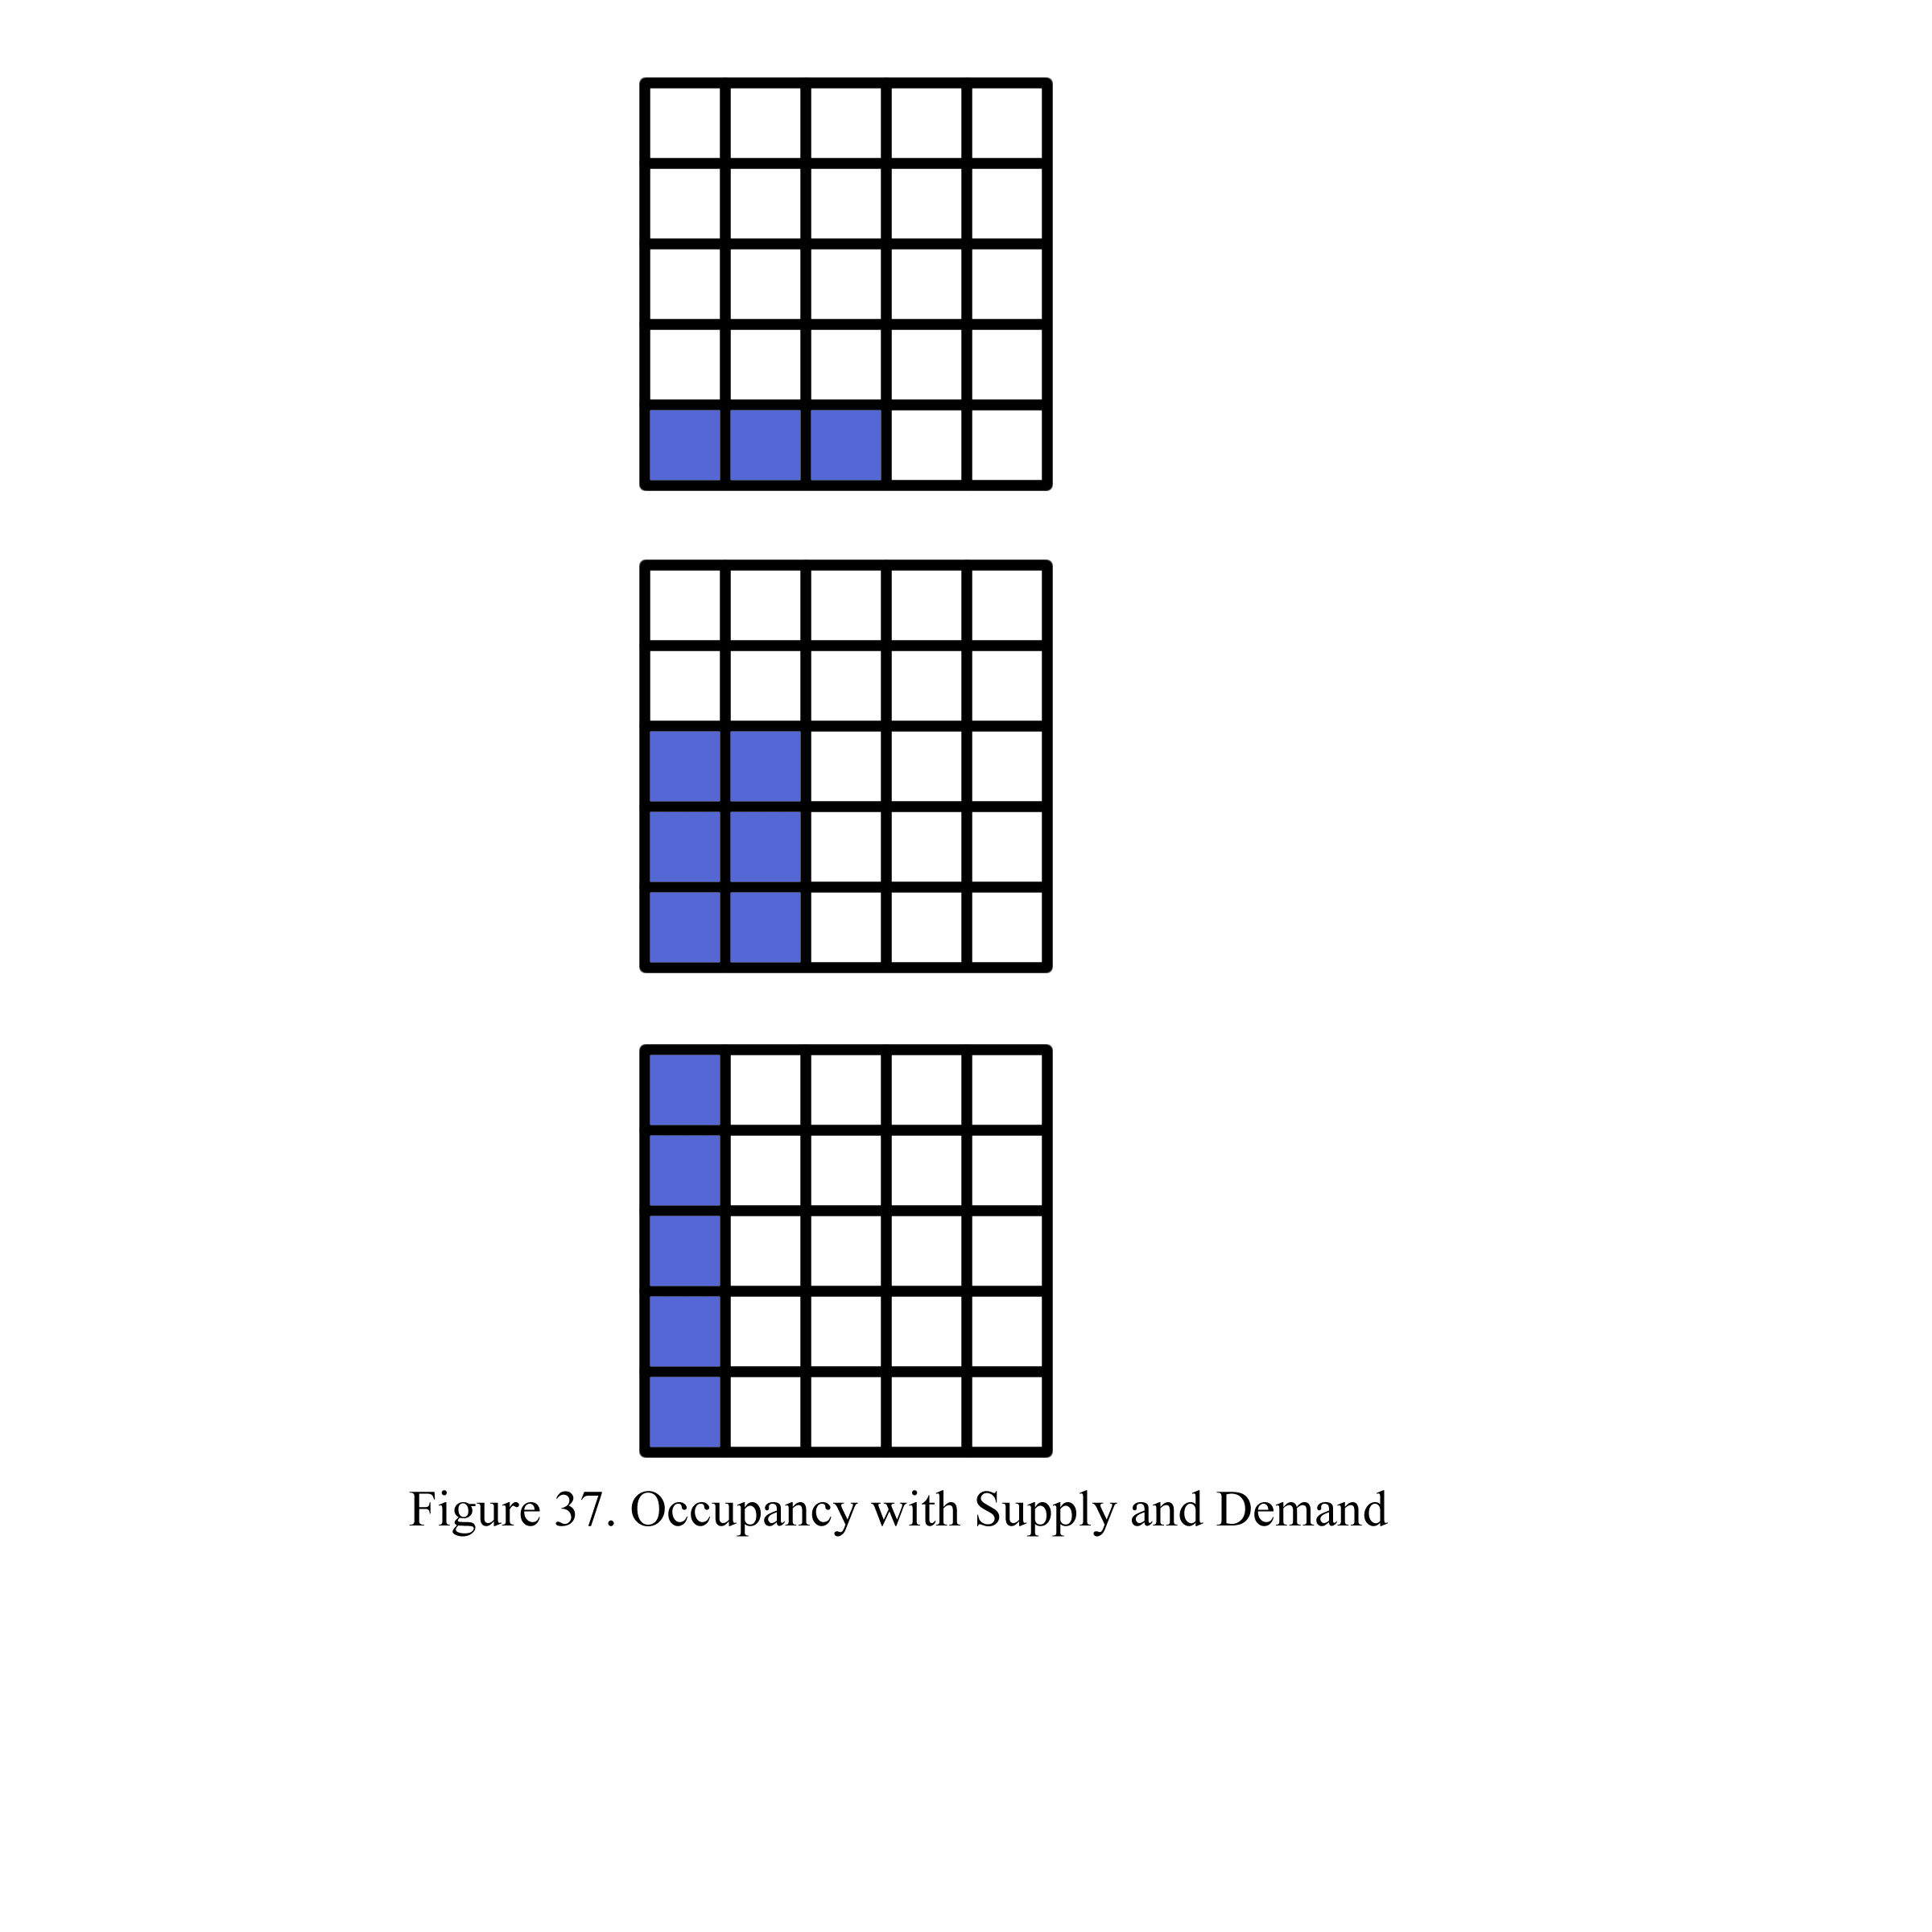
Occupancy can vary by room type due to different pricing. For instance, Figure 37 illustrates that the occupancy rates are 60% for $100 rooms, 40% for $300 rooms, and 20% for $500 rooms. Overall, with three room types, the hotel’s combined occupancy rate is 40% (6/15 or the average of 120% divided by 3) (Figure 37)

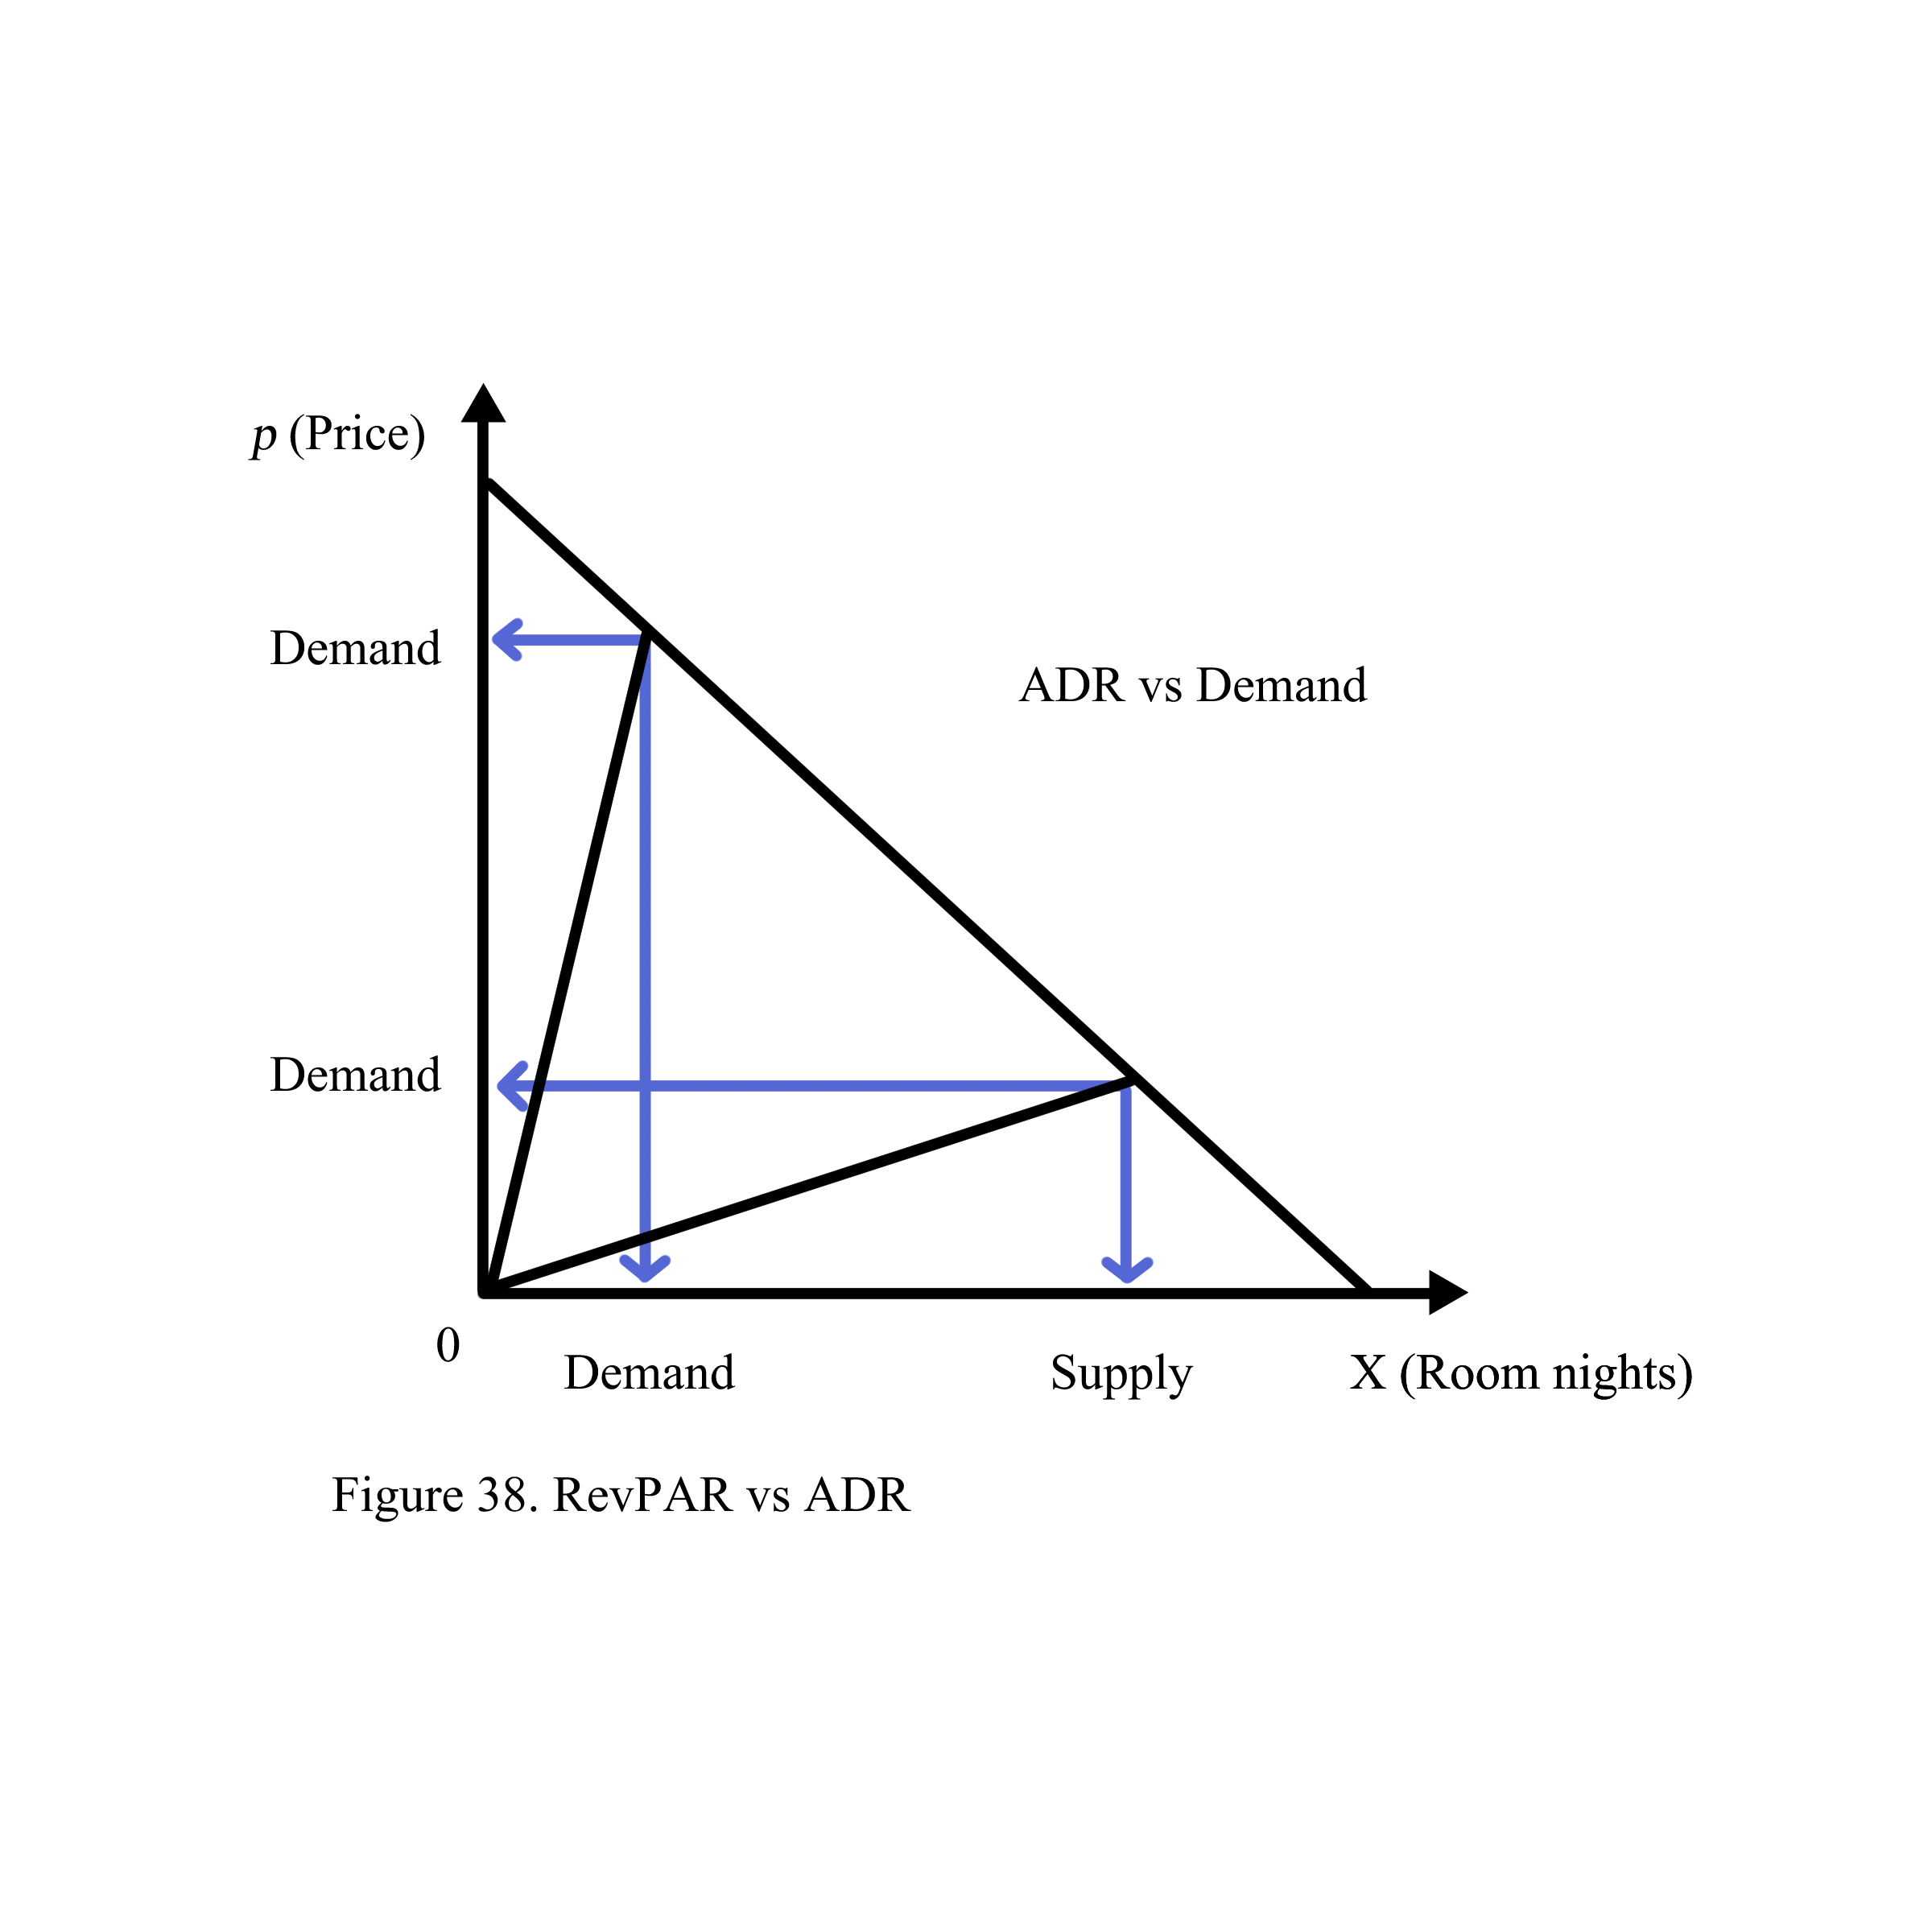
Revenue per Available Room (RevPAR) is defined as the average revenue generated from each room that is available. Unlike the Average Daily Rate (ADR), which reflects the revenue from rooms sold, RevPAR accounts for all available rooms. (See Figure 38).


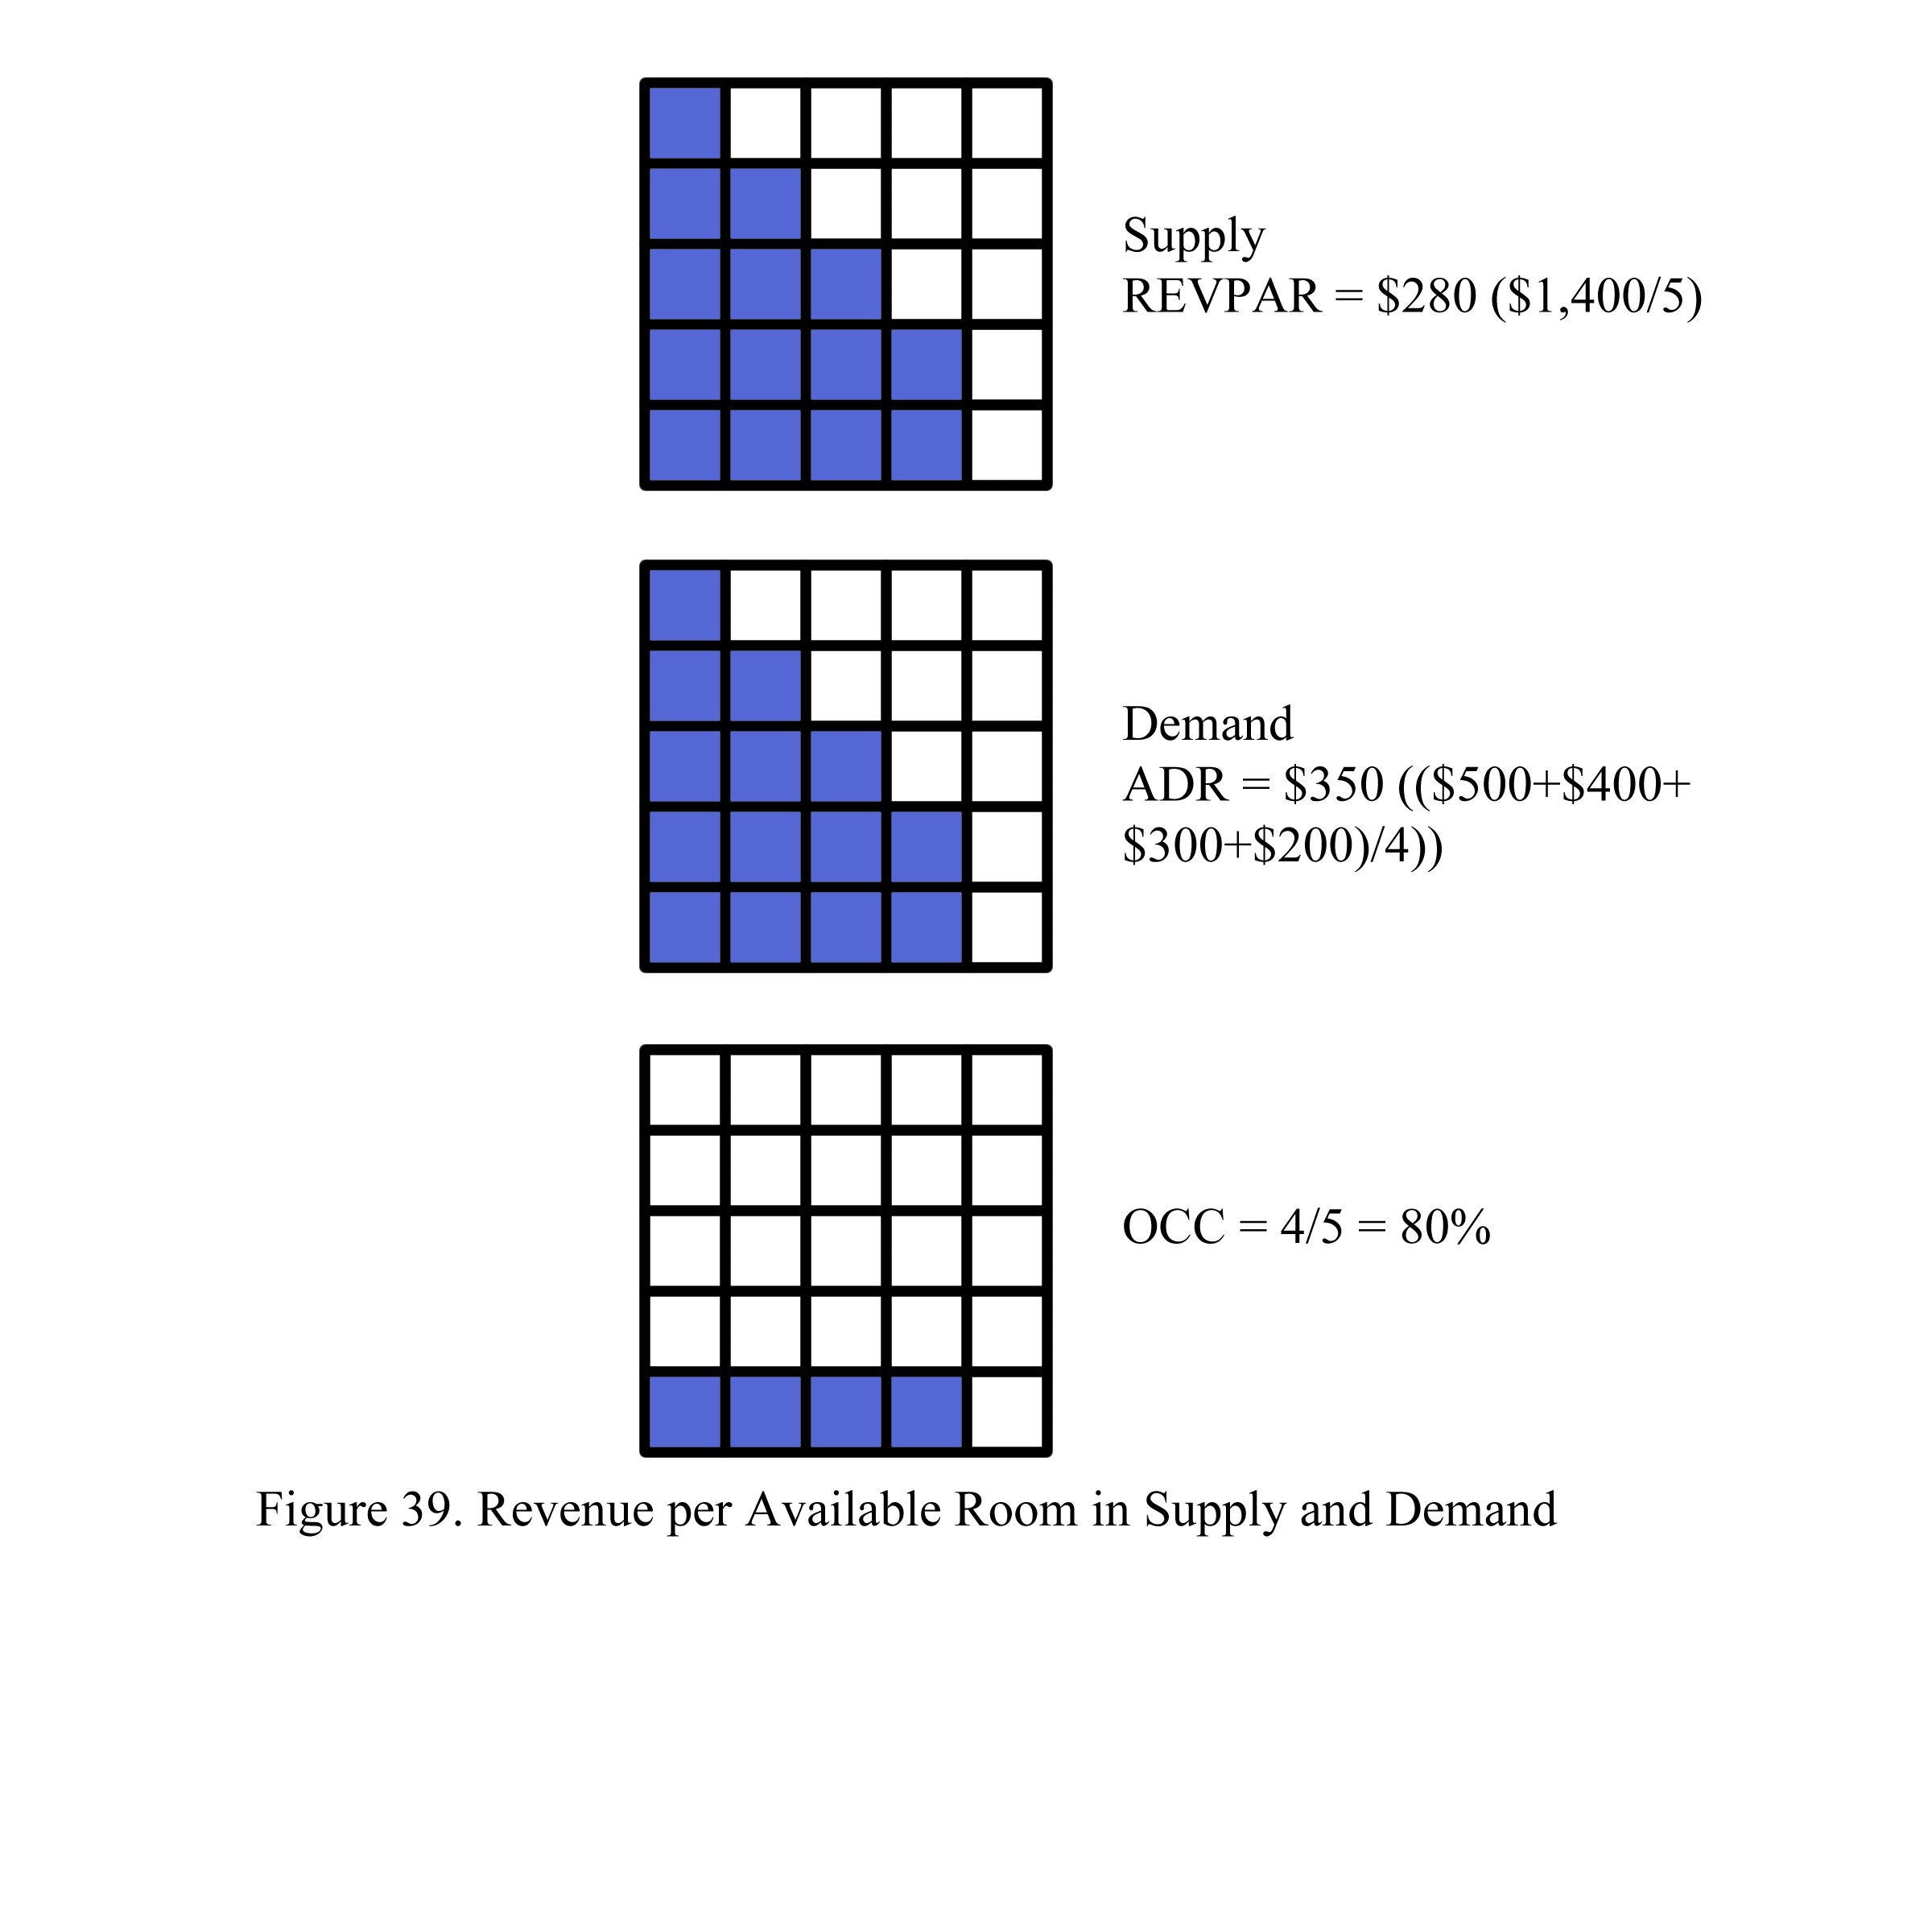
The relationship between ADR and RevPAR can be expressed as follows: Occupancy * ADR = RevPAR (refer to Figure 39).


Key terms

Hotel Demand: The total number of room nights that guests want to book at a hotel during a specific period. It reflects how many rooms guests are seeking to reserve.
Example: If a hotel has 100 rooms and guests want to book 120 room nights, the demand is 120 room nights.
Hotel Supply: The total number of room nights available for booking at a hotel during a specific period. It represents the capacity of the hotel to accommodate guests.
Example: If a hotel has 100 rooms and is open for 30 days, the supply is 100 rooms * 30 nights = 3,000 room nights.
Revenue: The total income generated from room sales and other services offered by the hotel over a certain period.
Example: If a hotel sells 100 room nights at $200 each, the revenue is 100 * $200 = $20,000.
Average Daily Rate (ADR): The average revenue earned per occupied room per night. It is calculated by dividing the total room revenue by the number of rooms sold.
Calculation: ADR = Total Room Revenue / Number of Rooms Sold
Example: If a hotel earns $10,000 from 100 room nights, the ADR is $10,000 / 100 = $100.
Revenue per Available Room (RevPAR): The average revenue earned from each available room, regardless of whether it is occupied or not. It combines room revenue and occupancy into one metric.
Calculation: RevPAR = ADR * Occupancy Rate
Alternatively: RevPAR = Total Room Revenue / Total Room Nights Available
Example: If a hotel’s ADR is $100 and its occupancy rate is 60%, the RevPAR is $100 * 60% = $60. If the hotel has a total of 100 rooms available for 30 nights and earns $180,000 in room revenue, the RevPAR is $180,000 / (100 * 30) = $60.
Occupancy Rate (OCC): The percentage of available rooms that are actually sold or occupied. It measures how well the hotel is filling its available capacity.
Calculation: OCC = (Number of Rooms Sold / Number of Rooms Available) * 100
Example: If a hotel has 100 rooms available and sells 60 of them, the occupancy rate is (60 / 100) * 100 = 60%.
Percent Change: The percentage difference between two values over time. It is used to measure growth or decline in performance metrics like revenue, occupancy, ADR, or RevPAR.
Calculation: Percent Change = [(New Value – Old Value) / Old Value] * 100
Example: If a hotel’s ADR increased from $90 to $100, the percent change is [(100 – 90) / 90] * 100 = 11.1%.

Yield Management: a strategic pricing approach used to maximize revenue by dynamically adjusting prices based on demand, supply, and other market factors. The primary goal is to sell the right product to the right customer at the right time for the right price. This technique is especially prevalent in industries with fixed capacities, such as hotels, airlines, and car rental services.
Dynamic Pricing: Prices are adjusted in real-time based on current demand, supply conditions, and other factors. This can include increasing prices during peak demand periods and offering discounts during low demand periods.
Example: A hotel might charge higher rates during peak vacation seasons and lower rates during off-peak times.
Segmented Pricing: Different customer segments are offered different prices based on their willingness to pay, booking behaviors, or other characteristics.
Example: Business travelers may pay higher rates for flexibility and convenience, while leisure travelers might book at discounted rates well in advance.
Forecasting: Accurate predictions about future demand are crucial for effective yield management. Forecasting involves analyzing historical data, market trends, and booking patterns.
Example: An airline might use past travel data and current booking trends to predict future flight demand and adjust ticket prices accordingly.
Inventory Control: Managing the availability of rooms, seats, or units to maximize revenue. This can involve restricting the number of discounted rates available or controlling the release of inventory based on demand.
Example: A hotel might limit the number of discounted room rates available to ensure that higher-paying guests can still book at peak times.
Overbooking: Intentionally booking more reservations than the available inventory to compensate for expected cancellations or no-shows. This strategy helps to optimize occupancy rates.
Example: An airline might overbook flights by a small percentage, knowing that some passengers will not show up.
Revenue Optimization: The core aim of yield management is to maximize revenue by balancing the pricing and availability of inventory to achieve the highest possible revenue for the business.
Example: A hotel might use a combination of high pricing during busy periods and lower pricing during quieter periods to optimize overall revenue.
Benefits of Yield Management:
Increased Revenue: By adjusting prices based on demand and other factors, businesses can increase their overall revenue.
Improved Occupancy Rates: Effective management of inventory and pricing can lead to higher occupancy rates, even during periods of lower demand.
Enhanced Customer Segmentation: Allows for tailored pricing strategies to different customer groups, maximizing revenue from each segment.
Optimized Resource Utilization: Ensures that fixed resources, such as hotel rooms or airline seats, are used as efficiently as possible.
Challenges of Yield Management:
Complexity: Requires sophisticated systems and algorithms to analyze data and adjust prices in real-time.
Customer Perception: Dynamic pricing can sometimes lead to customer dissatisfaction if they feel they are not getting a fair deal.
Data Dependence: Relies heavily on accurate data and forecasts, which can be challenging to obtain and analyze.

Review Questions

  1. Draw graphs to measure achievement factors to indicate the most index yield.
  2. In terms of revenue, draw graphs to show that room occupancy is the most important for the hotel.
  3. Describe hotel supply in terms of yield management in a competitive set. Compare hotel supply elasticity with average daily rate (ADR).
  4. Draw graphs to show Y: ADR/ADRmax, X: Occ, Surface: Yield.

License

Icon for the Creative Commons Attribution-NonCommercial-NoDerivatives 4.0 International License

Revenue Management Illustrated Copyright © 2024 by Xuan Tran is licensed under a Creative Commons Attribution-NonCommercial-NoDerivatives 4.0 International License, except where otherwise noted.

Share This Book