
6 Excel and Revenue Management Software
Competencies
- Understand manual application using Excel
- Identify software application
- Describe the trends for forecasting using software and Excel
Chapter Outlines
1. Comparing revenue margin between two competitors using Excel
2. Measuring maximized revenue in Monopoly using Excel Solver
3. 3-D graph including Price, Time and Demand for Software application
Revenue management is a critical function in the hospitality industry, particularly for hotels, where the primary goal is to maximize revenue by optimizing pricing and room inventory. By applying economic principles, revenue management seeks to balance supply and demand, ensuring that each room is sold at the highest possible price while also maintaining occupancy levels.
Key Decisions in Revenue Management
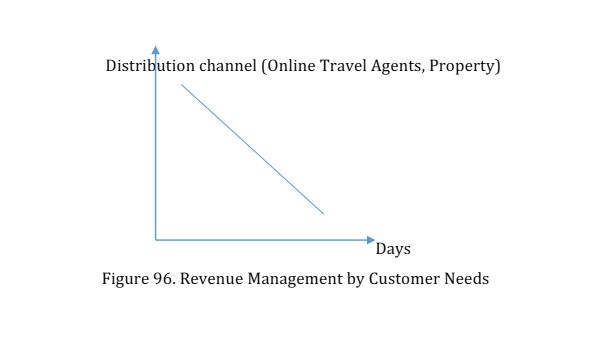
Distribution of Rooms Over Time
This decision involves strategically allocating rooms across different periods to optimize revenue. The goal is to manage room availability in a way that balances high-demand periods with lower-demand times, ensuring that rooms are available when customers are willing to pay premium prices. This may involve:
Forecasting Demand: Predicting future demand based on historical data, events, seasonality, and market trends.
Inventory Control: Limiting the number of rooms available at lower rates during high-demand periods to maximize revenue from those willing to pay more.
Overbooking Strategies: Anticipating no-shows and cancellations by slightly overbooking to ensure maximum occupancy. (Figure 96)
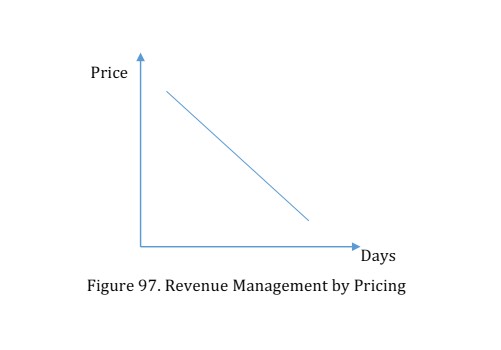
Setting Prices Strategically
Pricing is perhaps the most visible and impactful aspect of revenue management. The process involves setting and adjusting prices based on various factors to optimize revenue. Several pricing strategies are employed:
Individual Pricing: Tailoring prices to individual customers based on their booking patterns, loyalty status, or other personal data.
Reserve Pricing: Establishing a minimum acceptable price for rooms, below which rooms will not be sold, ensuring that revenue does not drop below a certain level.
Pricing Across Product Categories: Differentiating prices for various room types (e.g., standard vs. deluxe) and additional services (e.g., breakfast, parking).
Pricing Over Time: Implementing dynamic pricing, where room rates fluctuate based on demand, competition, and other external factors. This can include early bird discounts, last-minute deals, or surge pricing during peak times.
Discount Pricing: Offering discounts to specific segments (e.g., corporate clients, long-term stays, or group bookings) or during off-peak periods to boost occupancy without significantly eroding overall revenue. (Figure 97)
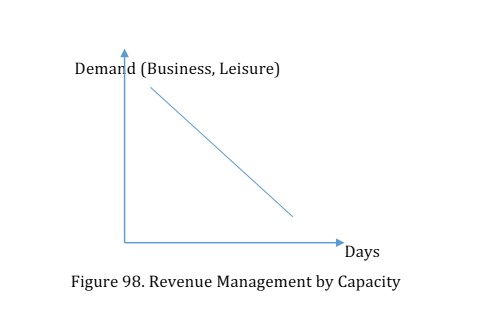
Measuring Capacity for Different Market Segments
This decision involves evaluating how room capacity can be allocated across different customer segments to maximize revenue. Not all segments are created equal—some may be more profitable than others. Key considerations include:
Segment Identification: Categorizing customers into segments such as business travelers, leisure travelers, groups, and event attendees.
Capacity Allocation: Determining how many rooms should be reserved for each segment based on their willingness to pay, booking patterns, and the hotel’s overall revenue strategy.
Yield Management: Continuously monitoring and adjusting room allocation to ensure that the most profitable segments are prioritized, especially during periods of high demand. (Figure 98)
Revenue management, therefore, is a complex, dynamic process that requires a deep understanding of market conditions, customer behavior, and economic principles. By making informed decisions in these three key areas—distribution, pricing, and capacity measurement—hotels can optimize their revenue streams and maintain a competitive edge in the marketplace.
Since the 1990s, revenue management software has revolutionized the way hotels manage pricing and occupancy, playing a critical role in enhancing Revenue Per Available Room (RevPAR). These software solutions leverage advanced algorithms to forecast demand and set optimal prices, leading to significant revenue increases, often ranging from 5% to 20% annually. The integration of such tools into hotel operations has become essential for those seeking to maintain a competitive edge in the increasingly data-driven hospitality industry.
Overview of Key Revenue Management Software
Several specialized software platforms have emerged over the years, each offering unique capabilities tailored to the needs of the hospitality industry:
Duetto
Founded: 2012, San Francisco
Reach: Hundreds of properties in 19 countries
Features: Duetto offers a cloud-based revenue management system that integrates real-time data, enabling dynamic pricing and personalized rate recommendations. It focuses on improving RevPAR by providing hoteliers with actionable insights based on demand forecasts, competitive pricing analysis, and customer behavior.
iRates
Founded: San Diego
Client Base: Approximately 100 clients
Features: iRates is known for its user-friendly interface and automation capabilities. It allows hoteliers to streamline revenue management processes with minimal manual input, making it particularly attractive to small and mid-sized properties. The software emphasizes simplicity while still offering powerful forecasting and pricing tools.
Pricematch
Client Base: 800 hotels
Features: Pricematch focuses on optimizing pricing strategies through a combination of machine learning and data analytics. It helps hoteliers adjust room rates dynamically based on real-time market conditions, ensuring that they remain competitive while maximizing revenue.
Rainmaker
Specialization: Hotel gaming companies
Features: Rainmaker offers a suite of revenue management solutions tailored to the unique needs of hotels within the gaming industry. Its tools are designed to handle the complexities of large-scale properties, integrating gaming data with traditional hotel metrics to optimize both gaming and non-gaming revenue streams.
Limited Adoption Despite Proven Benefits
Despite the proven effectiveness of these software solutions, adoption among hoteliers remains relatively low. Approximately 10% of hoteliers utilize specialized revenue management software, while the majority continue to rely on Excel spreadsheets to manage their revenue strategies. This reliance on manual processes can limit the ability of hotels to fully capitalize on real-time data and sophisticated forecasting techniques, potentially leaving revenue opportunities on the table.
The Role of Excel in Revenue Management
For many hoteliers, Excel remains the tool of choice due to its flexibility, familiarity, and cost-effectiveness. Excel allows for customized revenue management strategies, where hoteliers can manually input data, create models, and visualize outcomes using graphs and charts. However, this approach requires a significant time investment and may lack the precision and scalability of specialized software.
Chapter Focus: Excel Techniques and Software Manipulation
In this chapter, we will delve into the practical application of Excel for revenue management. We will explore techniques for creating dynamic pricing models, forecasting demand, and visualizing data through graphs. Additionally, we will examine how to manipulate and interpret outputs from specialized revenue management software, providing a comprehensive understanding of both manual and automated approaches to revenue optimization.
This dual approach ensures that hoteliers can make informed decisions about when to rely on traditional methods like Excel and when to invest in more advanced software solutions, ultimately enabling them to maximize their revenue potential.
It is important to highlight that the majority of revenue management software systems on the market are primarily geared toward independent hotels, which often lack the resources to develop their own proprietary revenue management (RM) tools. These off-the-shelf software solutions provide independent hotels with access to advanced RM capabilities, allowing them to compete effectively with larger, brand-affiliated properties.
The Role of Revenue Management Software for Independent Hotels
Independent hotels typically face unique challenges in revenue management. Without the backing of a large brand, they must rely on third-party software to implement sophisticated RM strategies. These tools, such as Duetto, iRates, Pricematch, and Rainmaker, are designed to provide the advanced analytics, demand forecasting, and dynamic pricing capabilities that are essential for maximizing revenue. For many independent properties, these systems level the playing field, enabling them to operate with the same level of sophistication as their branded counterparts.
Proprietary RM Software in Branded Hotels
On the other hand, branded hotels—those affiliated with major hotel chains—often have access to proprietary revenue management software developed specifically for their needs. These systems are typically integrated into the brand’s larger technology ecosystem, offering seamless connectivity with other operational systems such as property management, customer relationship management, and central reservations systems.
Advantages of Brand-Affiliated RM Software:
Customization and Integration
Proprietary RM software is often highly customized to align with the brand’s specific strategies and standards. This ensures consistency across all properties under the brand umbrella, allowing for a unified approach to revenue management. Additionally, these systems are deeply integrated with other brand-wide technologies, enabling real-time data sharing and a holistic view of the property’s performance.
Centralized Support and Expertise
Brands provide centralized support and training for their proprietary RM software, ensuring that all affiliated hotels are using the system effectively. This support often includes access to expert revenue managers who can assist with strategy development and system optimization, providing a significant advantage to properties that might otherwise struggle to implement sophisticated RM techniques on their own.
Economies of Scale
By developing and maintaining their own RM software, brands can achieve economies of scale, spreading the cost of these advanced systems across a large portfolio of properties. This makes it more cost-effective for individual hotels within the brand to access cutting-edge RM tools that might otherwise be prohibitively expensive for an independent property.
The Strategic Advantage of Brand Affiliation
The availability of proprietary RM software is one of the key strategic advantages of brand affiliation. For hotels, joining a brand not only brings the benefit of recognized name recognition and established marketing channels but also provides access to advanced operational tools that independent properties may find difficult to obtain or develop. This can significantly enhance a hotel’s ability to optimize revenue, streamline operations, and compete in a highly competitive market.
Conclusion
While independent hotels rely on commercially available revenue management software to level the playing field, branded hotels enjoy the benefits of proprietary systems designed specifically for their needs. This access to specialized RM tools is a significant advantage of brand affiliation, allowing hotels to maximize revenue potential and maintain a competitive edge in the marketplace. Whether independent or brand-affiliated, the choice of RM software is a critical decision that can have a profound impact on a hotel’s financial performance and overall success.
6.1. Manual Application of Revenue Management Using Excel
While specialized revenue management software offers advanced features and automation, many hoteliers still rely on Excel for their revenue management needs. Excel remains a powerful tool for those who prefer a more hands-on approach or lack the resources to invest in expensive software. By leveraging Excel’s versatility, hoteliers can create customized models, conduct detailed analysis, and develop strategies that are tailored to their specific business needs.
Benefits of Using Excel for Revenue Management
Cost-Effective Solution
Excel is widely available and often already part of a hotel’s existing software suite, making it a cost-effective solution for revenue management. For small and independent hotels, this is particularly advantageous as it avoids the need for additional investment in specialized software.
Flexibility and Customization
One of the main advantages of using Excel is its flexibility. Hoteliers can build customized models that reflect their unique business environment, market conditions, and strategic goals. Unlike standardized software, which may impose certain limitations, Excel allows for the creation of tailored solutions that can be adjusted as needed.
Transparency and Control
Excel provides full transparency over the revenue management process. Hoteliers have complete control over every aspect of their models, from data input to formulae, allowing them to understand precisely how results are generated. This transparency fosters a deeper understanding of revenue management principles and the factors that influence pricing and occupancy decisions.
Key Excel Techniques for Revenue Management
Demand Forecasting
Historical Data Analysis: Excel allows hoteliers to analyze historical booking data to identify trends and patterns. By using functions such as moving averages, seasonality analysis, and regression, hoteliers can forecast future demand based on past performance.
Scenario Analysis: Excel’s “What-If” analysis tools, such as Scenario Manager and Data Tables, enable hoteliers to test various demand scenarios. This helps in understanding how different factors (e.g., economic conditions, competition, or events) might impact future bookings and revenue.
Dynamic Pricing Models
Price Elasticity of Demand: By analyzing the relationship between room rates and occupancy levels, hoteliers can use Excel to calculate price elasticity. This involves creating models that simulate how changes in pricing might affect demand, allowing for more informed pricing decisions.
Rate Optimization: Excel can be used to build dynamic pricing models that adjust room rates based on various factors, such as occupancy levels, lead time, and market conditions. Solver, a powerful Excel add-in, can be used to optimize pricing strategies by finding the rate that maximizes revenue while considering constraints like room availability and minimum stay requirements.
Inventory Management
Overbooking Models: Excel can help manage inventory by allowing hoteliers to model overbooking scenarios. By analyzing historical cancellation and no-show rates, hoteliers can use Excel to determine the optimal number of rooms to overbook, balancing the risk of turning away guests against the potential revenue from maximizing occupancy.
Room Allocation: Excel’s data analysis tools can be used to allocate rooms across different segments (e.g., business vs. leisure travelers) based on forecasted demand and profitability. PivotTables and conditional formatting can help visualize and adjust allocation strategies in real-time.
Revenue Tracking and Analysis
RevPAR and ADR Calculation: Excel simplifies the calculation of key performance metrics such as Revenue Per Available Room (RevPAR) and Average Daily Rate (ADR). By inputting data on room revenue, occupancy, and available room nights, Excel can automatically calculate these metrics, providing insights into the property’s financial performance.
Graphical Analysis: Excel’s charting tools enable the visualization of revenue trends, occupancy rates, and pricing strategies. Graphs such as line charts, bar charts, and scatter plots can help identify correlations and trends, making it easier to communicate findings and make data-driven decisions.
Scenario Planning and Sensitivity Analysis
Scenario Planning: Excel allows hoteliers to model different revenue management scenarios, such as varying levels of demand or changes in market conditions. By using Excel’s Scenario Manager, hoteliers can compare the outcomes of different strategies and identify the most effective approach for maximizing revenue.
Sensitivity Analysis: Sensitivity analysis involves testing how sensitive revenue outcomes are to changes in key variables, such as room rates, demand levels, or costs. Excel’s Data Tables can be used to perform sensitivity analysis, providing insights into which factors have the most significant impact on revenue and helping to fine-tune revenue management strategies.
Challenges of Using Excel for Revenue Management
Time-Consuming Process
Building and maintaining revenue management models in Excel can be time-consuming, particularly for larger properties with complex operations. The manual nature of Excel requires constant updates and adjustments, which can be labor-intensive.
Potential for Human Error
The manual input and formulae in Excel increase the risk of errors, which can lead to inaccurate forecasts and suboptimal pricing decisions. Even minor mistakes, such as incorrect data entry or formula errors, can have significant consequences on revenue outcomes.
Limited Automation
Unlike specialized revenue management software that can automate many processes, Excel requires manual intervention for updates and calculations. This limits the ability to respond quickly to changes in market conditions or demand patterns, potentially missing out on revenue opportunities.
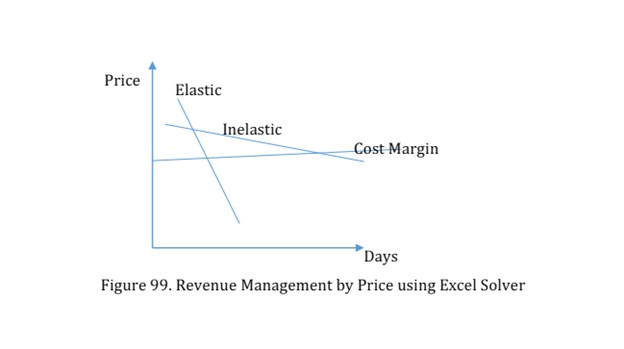
Using Excel for revenue management offers a cost-effective, flexible, and transparent approach that allows hoteliers to create customized solutions tailored to their specific needs. While it may require more time and effort compared to specialized software, Excel provides a valuable tool for those who prefer a hands-on approach or lack the resources to invest in advanced technology. By mastering key Excel techniques such as demand forecasting, dynamic pricing, and revenue analysis, hoteliers can effectively manage their revenue and optimize their financial performance (Figure 99)
Using Excel Graphs and Solver to Find the Profit-Maximizing Output and Price
Excel is a versatile tool that can be used to model and solve complex revenue management problems, such as determining the profit-maximizing output and price for a hotel. By utilizing Excel’s graphing capabilities and the Solver add-in, hoteliers can visually analyze market dynamics and optimize their pricing strategies to maximize profits.
1.1 Market Demand and Inverse Demand
The demand for hotel rooms in a given market can be represented by a linear demand function:
Market Demand Function: Q=a−bP
Where:
Q is the quantity of rooms demanded.
P is the price per room.
a and b are constants that reflect market characteristics.
The inverse demand function, which expresses the price as a function of the quantity demanded, is given by:
Inverse Demand Function: P=d0−d1Q
Where:
d0=a/b
d1=1/b
This inverse demand function can be graphed in Excel to visualize how the price changes with varying levels of demand (Figure 100).
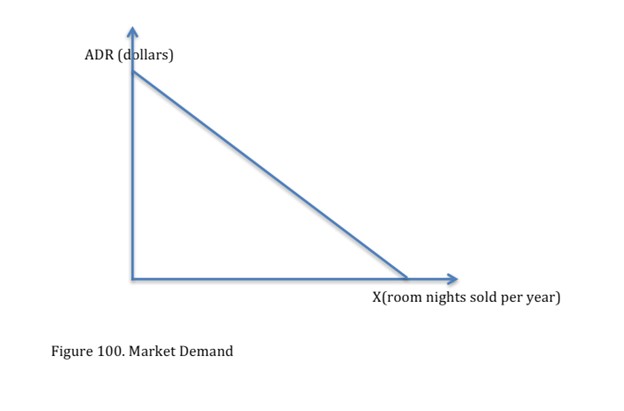
By plotting this curve, hoteliers can better understand the price elasticity of demand and how price adjustments might impact occupancy rates.
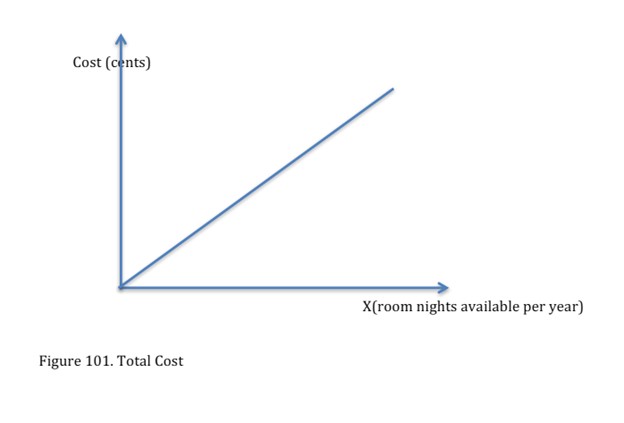
1.2 Total Cost Function
The total cost (TC) associated with providing rooms can be modeled using a polynomial cost function:
Total Cost Function: TC=c3Q^3+c2Q^2+c1Q^1+c0
Where:
c3, c2, c1c, and c0 are constants that define the cost structure.
This function accounts for fixed costs (captured by c0) and variable costs that may increase at a non-linear rate as more rooms are sold. The TC function can be plotted in Excel (Figure 101) to illustrate how costs escalate with increased output. Understanding this relationship is crucial for determining the quantity of rooms that will maximize profit.
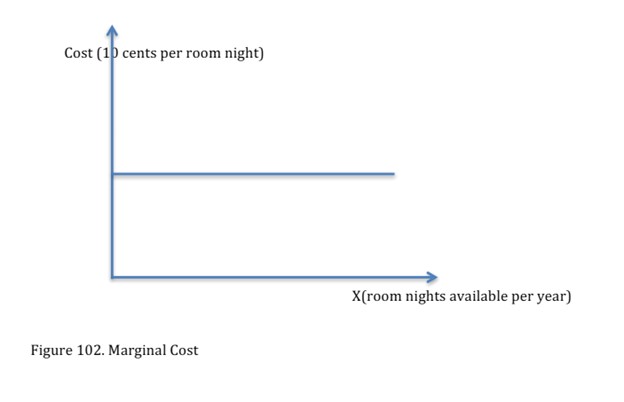
1.3 Marginal Cost
Marginal Cost (MC) represents the additional cost incurred for each additional room sold. It can be calculated as the derivative of the total cost function or by simply finding the difference in total cost as output increases by one unit:
Marginal Cost Function: MC=ΔQ/ΔTC
In Excel, the marginal cost can be calculated using the difference formula across the total cost data points (Figure 102). Plotting the MC curve alongside the marginal revenue (derived from the inverse demand function) allows for the identification of the profit-maximizing output level—where marginal cost equals marginal revenue.
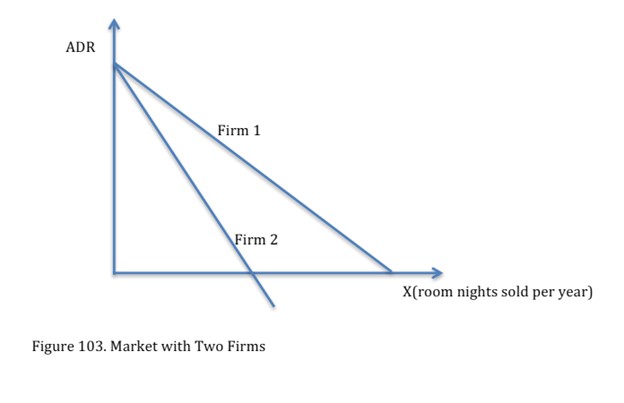
1.4 Market with Two Firms
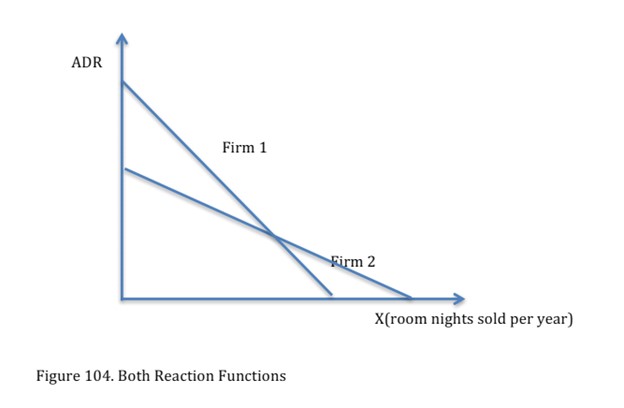
When multiple hotels compete in the same market, the competitive dynamics must be considered. In a duopoly, for example, each hotel’s pricing and output decisions affect not only their own profits but also those of their competitor. This scenario can be modeled using reaction functions, which show how one hotel might adjust its output or pricing in response to the actions of the other.
Market with Two Firms: This can be visualized in Excel by plotting the reaction functions of both firms (Figure 103). These curves illustrate the strategic interdependence between the competing hotels, helping hoteliers anticipate competitor behavior and adjust their strategies accordingly.
1.5 Reaction Functions and Market Equilibrium
The reaction functions (see Figure 104) represent the strategic decisions of two competing hotels in the market. Each hotel’s reaction function shows the optimal output or pricing response to the competitor’s actions. The intersection of these reaction functions represents the Nash equilibrium, where neither hotel can improve its profit by unilaterally changing its strategy.
Reaction Function Analysis: By plotting these functions in Excel, hoteliers can analyze the equilibrium outcome of the competitive market. This helps in understanding how changes in one hotel’s pricing or output will influence the overall market dynamics and profit outcomes.
Using Excel Solver for Optimization
To determine the profit-maximizing output and price, Excel’s Solver add-in can be used. Solver is a powerful optimization tool that can find the optimal solution by adjusting decision variables within specified constraints.
Steps to Use Solver:
Set Up the Objective Function:
Define the objective function, which in this case is the profit function Π=TR−TC, where TR is total revenue (P×Q) and TC is total cost. The goal is to maximize this function.
Define the Decision Variables:
The decision variable is the quantity of rooms Q, which Solver will adjust to maximize profit.
Set Constraints:
Include constraints such as non-negative quantity Q≥0 and possibly upper limits based on room capacity.
Run Solver:
Solver will iterate through possible values of Q to find the value that maximizes the profit function.
The optimal output and corresponding price found through Solver will be the point where the difference between total revenue and total cost is the greatest, providing the hotel with the highest possible profit under the given market conditions.
Using Excel’s graphing tools and Solver add-in, hoteliers can effectively model complex revenue management scenarios, including demand forecasting, cost analysis, and competitive market dynamics. These tools allow for a hands-on approach to determining the profit-maximizing output and price, even in the absence of advanced revenue management software. By mastering these Excel techniques, hoteliers can enhance their decision-making processes and optimize their financial performance in a competitive market environment (Figure 104)
6.2. Using Software for Deterministic and Dynamic Models in Revenue Management
Revenue management in the hospitality industry involves sophisticated decision-making processes that can be significantly enhanced by using specialized software. These tools allow hoteliers to apply complex mathematical models to forecast demand, set prices, and optimize revenue. Two key types of models used in this context are deterministic and dynamic models. Understanding and utilizing these models through software can provide hotels with a competitive edge in a highly dynamic market.
Overview of Deterministic and Dynamic Models
Deterministic Models: These models focus on a fixed point in time, where the competition between hotels is analyzed under specific conditions. They rely on known variables to predict outcomes, such as pricing and demand, without accounting for variability over time.
Dynamic Models: In contrast, dynamic models account for the changing nature of the market over time. They incorporate historical data, market trends, and the elasticity of demand to simulate and predict competitive interactions between hotels over an extended period.
2.1 Deterministic Model
In a deterministic model, the goal is to maximize revenue by forecasting the optimal quantity of rooms to sell and the price to set at a specific moment. This model assumes that all variables are known with certainty and that the environment does not change during the period of analysis.
Application of Probability in Forecasting:
Deterministic models often use probability-based techniques to forecast demand and pricing strategies. For example, an expert yield management system may incorporate Bayesian analysis to update predictions based on new information, enhancing the accuracy of the forecasts. Decision trees can also be utilized to map out possible outcomes based on different pricing and occupancy scenarios.
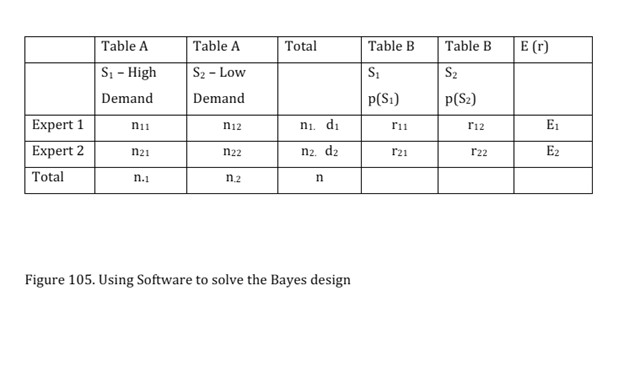
Bayesian Analysis (Figure 105):
Bayesian analysis is a statistical method that updates the probability of a hypothesis as more evidence or information becomes available. In revenue management, this can be used to refine predictions about demand and pricing, leading to more precise decision-making.
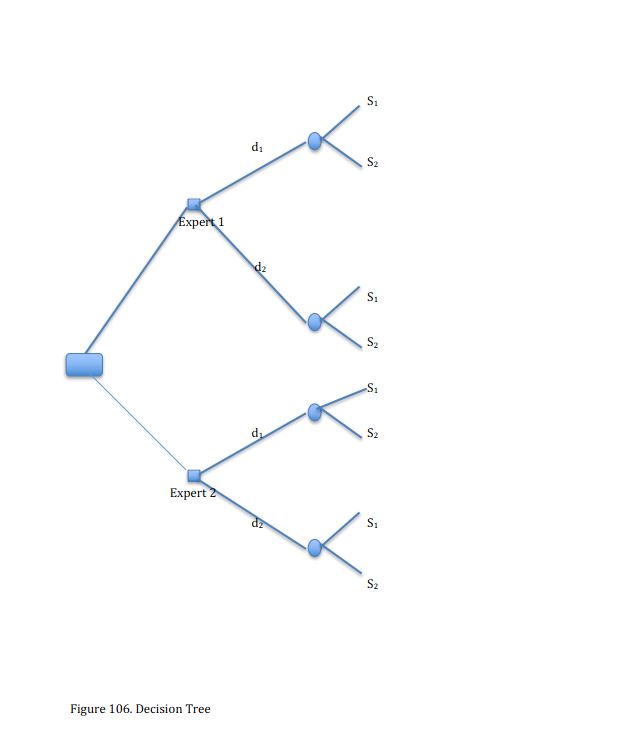
Decision Tree (Figure 106):
A decision tree is a graphical representation of possible outcomes based on different decisions. In the context of revenue management, it can be used to evaluate various pricing strategies, illustrating the potential revenue outcomes for each option.
Software Implementation:
Revenue management software can automate the process of building and analyzing deterministic models. These tools typically include features that allow users to input specific variables, such as room inventory, historical demand data, and competitor pricing. The software then runs simulations to determine the optimal pricing and inventory allocation strategies to maximize revenue at a given time.
2.2 Dynamic Model
Dynamic models extend the analysis over a longer period, taking into account the evolving nature of the market. These models recognize that factors such as demand, pricing, and competition are not static but change over time. As a result, they use historical data and elasticity measures to forecast how these variables will interact in the future.
2.2.1. Obtain different scenarios
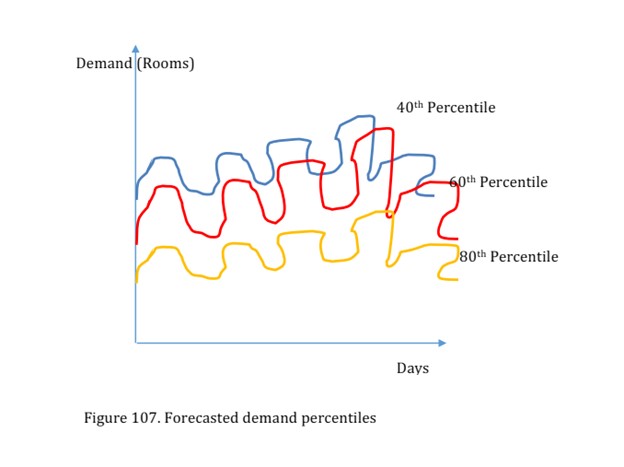
Elasticity and Historical Data:
In a dynamic model, revenue management software uses elasticity, which measures how sensitive demand is to changes in price. By analyzing historical data, the software can identify patterns and predict how changes in pricing will affect demand across different time periods (Figure 107)
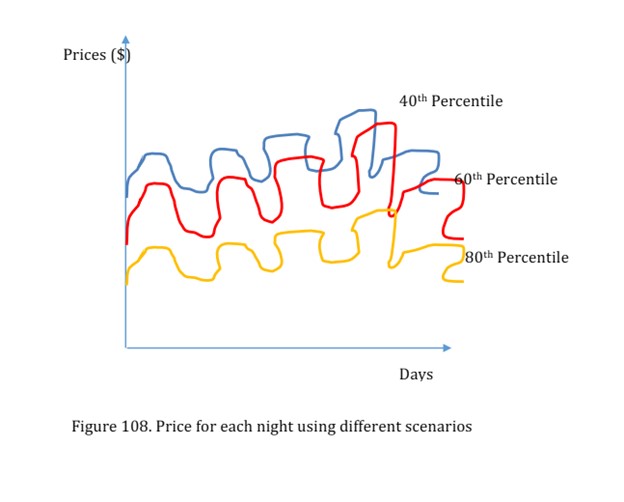
Price Elasticity:
The software evaluates how a change in room rates impacts the quantity of rooms sold. For example, if data shows that a 10% increase in price leads to a 5% drop in demand, the software can use this information to set prices that balance occupancy and revenue. (Figure 108)
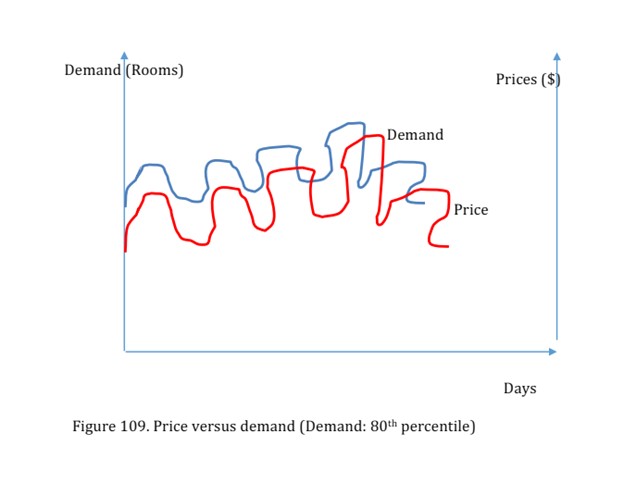
Room Allocation Strategies:
Dynamic models also involve allocating a certain number of rooms to different pricing categories. For instance, hotels might allocate more rooms to lower-priced categories for early reservations, attracting budget-conscious travelers. As demand increases closer to the booking date, the hotel can then adjust room availability and pricing to capitalize on last-minute bookings at higher rates (Figure 109)
Software Implementation:
Revenue management software designed for dynamic modeling continuously updates predictions and strategies based on real-time data. These tools can adjust pricing and inventory allocation automatically as market conditions change, ensuring that the hotel maximizes revenue over the long term.
Martial Law Example:
The concept of martial law in dynamic modeling refers to the principle that increasing prices will typically reduce demand (following the law of demand). Software using dynamic models will consider this relationship and use elasticity to find the optimal balance between price and quantity sold.
Benefits of Software for Deterministic and Dynamic Models
Accuracy:
By leveraging advanced algorithms and real-time data, software can produce more accurate forecasts and pricing strategies than manual methods. This precision helps hotels avoid overpricing or underpricing rooms, both of which can negatively impact revenue.
Efficiency:
Automating the modeling process saves time and reduces the complexity involved in revenue management. Hoteliers can quickly adjust strategies as market conditions change, rather than relying on static models that may become outdated.
Competitive Advantage:
Hotels that use software for deterministic and dynamic modeling can more effectively anticipate and respond to competitor actions. This proactive approach enables them to capture more market share and optimize revenue in a highly competitive environment.
Conclusion
Using specialized software to implement deterministic and dynamic models provides a powerful toolset for maximizing hotel revenue. Deterministic models offer a snapshot analysis of optimal pricing and room allocation at a specific time, while dynamic models provide a more comprehensive view of market interactions over an extended period. By integrating these models into their revenue management strategies, hotels can make data-driven decisions that enhance profitability and maintain a competitive edge in the market.
2.2.2. Obtaining Scenarios Using Overlapping Percentages
In dynamic revenue management models, scenarios are often created by overlapping different percentages to forecast demand, set prices, and analyze the relationship between price and demand at specific capacity levels. These scenarios allow hoteliers to visualize and optimize their strategies by considering how different variables interact over time.
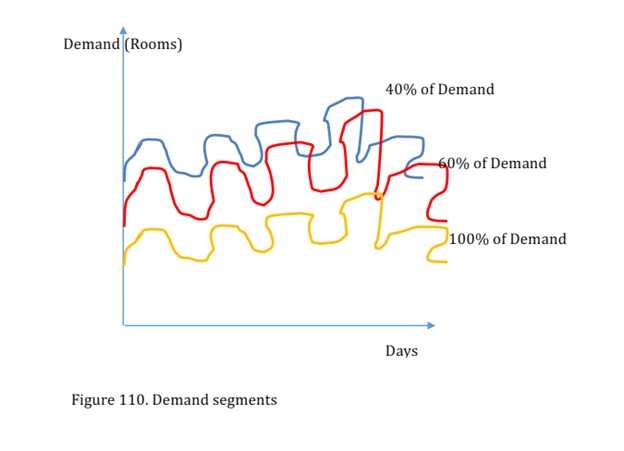
(1) Forecasted Demand (Figure 110)
The first step in scenario creation is to forecast demand using overlapping percentage techniques. This involves blending various demand forecasts to create a more nuanced and reliable prediction.
Overlapping Forecasts:
By combining different forecasts—such as those based on historical data, market trends, and current booking patterns—hoteliers can generate a composite demand forecast that accounts for different possible outcomes. This method increases the accuracy of demand predictions by mitigating the impact of any one forecasting method’s biases or limitations.
Graphical Representation (Figure 110):
The overlapping demand forecast is visualized in Figure 110, where multiple demand curves are plotted on the same graph. The area where these curves overlap represents the most likely demand range for the given period. This visualization helps identify the core demand zone, which can be crucial for setting appropriate prices and managing inventory.
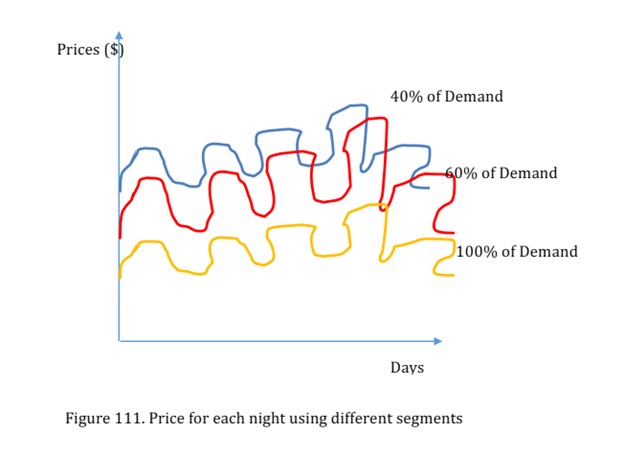
(2) Price Forecast (Figure 111)
After forecasting demand, the next step is to determine the optimal pricing strategy by overlapping price forecasts.
Overlapping Price Scenarios:
Similar to demand forecasting, price forecasts can be generated using different methods, such as competitor pricing analysis, price elasticity, and customer willingness to pay. These forecasts are then overlapped to determine a pricing range that aligns with the most likely demand scenario.
Graphical Representation (Figure 111):
Figure 111 shows the overlapping price scenarios, where multiple pricing curves intersect. The overlap area indicates the optimal pricing range that should be applied based on the most accurate demand forecast. This approach helps in setting a dynamic pricing strategy that adjusts to market conditions while maximizing revenue.
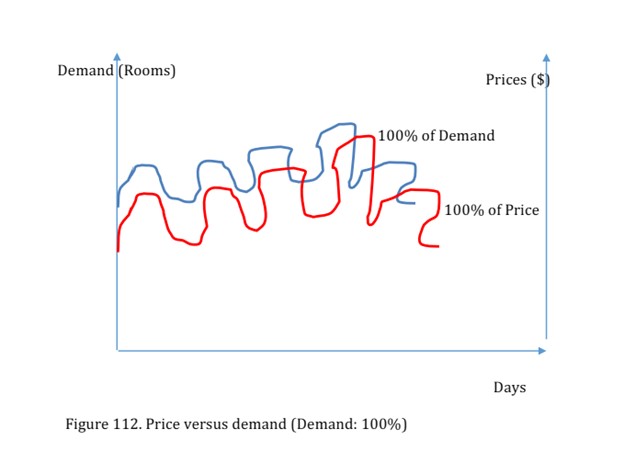
(3) Price versus Demand for Specific Capacity (Figure 112)
The final aspect of the scenario involves analyzing the relationship between price and demand for a specific hotel capacity.
Price-Demand Relationship:
By using the overlapping demand and price forecasts, hoteliers can plot the relationship between price and demand for a specific number of available rooms. This relationship is crucial for understanding how price changes will affect occupancy levels and overall revenue.
Graphical Representation (Figure 112):
Figure 112 illustrates the price versus demand relationship for a specific capacity. The graph shows how demand varies across different price points, allowing hoteliers to identify the price that maximizes occupancy without compromising revenue. This visualization is key to optimizing pricing strategies based on current and forecasted market conditions.
3. Manipulating Hotel Capacity for Revenue Optimization
Hotel capacity manipulation involves adjusting the available room inventory and pricing strategies to optimize revenue. By integrating different capacity segments into a cohesive strategy, hoteliers can better match supply with demand and maximize profitability.
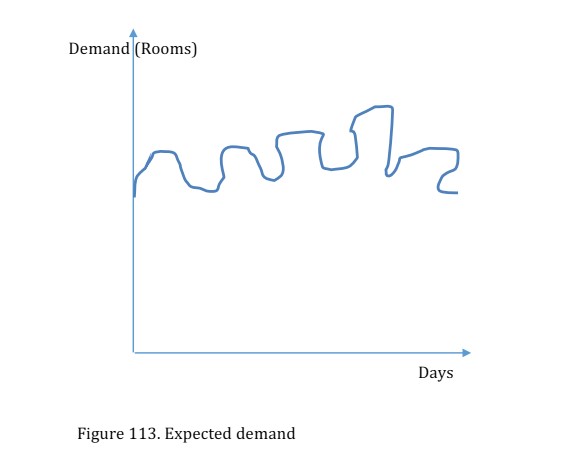
(1) Integrating Total Capacity into One Overlapping Segment (Figure 113)
One approach to capacity management is to integrate the total capacity of the hotel into a single overlapping segment. This method involves considering the entire room inventory as a dynamic pool that can be allocated across different segments based on demand forecasts.
Unified Capacity Management:
Instead of treating different room types or categories as separate entities, the hotel’s total capacity is managed as one overlapping segment. This allows for more flexible room allocation based on real-time demand, leading to better occupancy rates and higher revenue.
Graphical Representation (Figure 113):
Figure 113 depicts the integration of total capacity into one overlapping segment. The graph shows how different room categories are blended into a unified capacity strategy, with overlapping segments representing the rooms that can be flexibly allocated based on demand. This approach helps in smoothing out fluctuations in occupancy and ensures that all rooms are utilized efficiently.
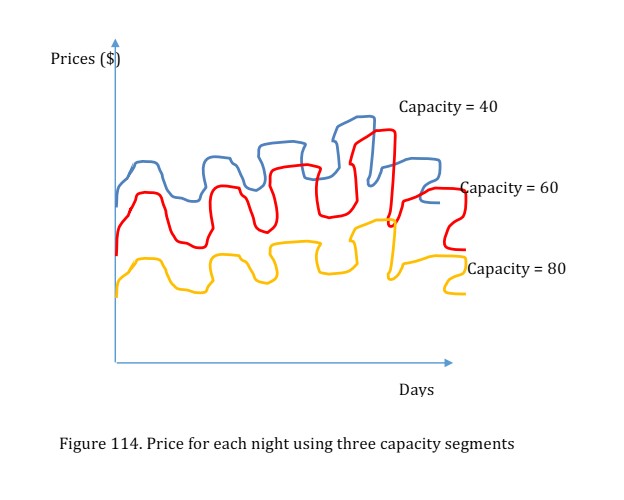
(2) Pricing for Each Night Using Different Capacity Segments (Figure 114)
Once the total capacity is integrated, the next step is to set prices for each night based on the different capacity segments.
Segmented Pricing Strategy:
Different capacity segments can be priced differently depending on the expected demand for each night. For example, premium rooms might be priced higher on weekends, while standard rooms could be discounted during off-peak periods. This segmentation allows for more targeted pricing strategies that maximize revenue for each room type.
Graphical Representation (Figure 114):
Figure 114 illustrates the pricing strategy for different capacity segments across multiple nights. The graph shows how prices vary based on expected demand and capacity utilization. By visualizing these pricing differences, hoteliers can better understand how to price each segment to optimize overall revenue.
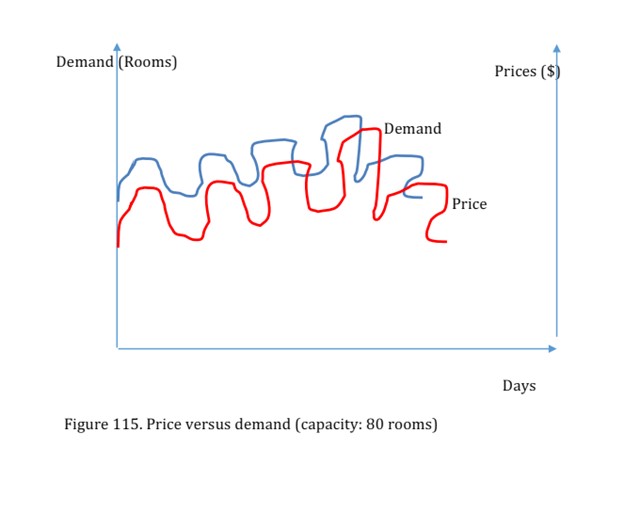
(3) Price versus Demand for a Certain Capacity (Figure 115)
The final step in capacity manipulation is to analyze the relationship between price and demand for a specific capacity segment.
Capacity-Specific Price-Demand Analysis:
By focusing on a particular segment of the hotel’s capacity, hoteliers can determine the optimal price point that maximizes demand while ensuring profitability. This analysis helps in fine-tuning pricing strategies for each segment based on real-time market conditions and demand forecasts.
Graphical Representation (Figure 115):
Figure 115 shows the price versus demand relationship for a specific capacity segment. The graph highlights how changes in pricing affect demand for that segment, helping hoteliers identify the price that maximizes revenue while maintaining high occupancy rates. This targeted analysis is essential for refining pricing strategies and ensuring that each room is sold at the best possible rate.
Conclusion
Using overlapping percentage techniques in forecasting demand, setting prices, and analyzing the price-demand relationship allows hoteliers to create more accurate and reliable revenue management scenarios. By manipulating hotel capacity and applying these insights, hoteliers can develop dynamic pricing strategies that maximize occupancy and revenue. The graphical representations provided in Figures 110 to 115 offer a visual framework for understanding these complex relationships, enabling more effective decision-making and optimization in a competitive market environment.
Key Terms
Duetto: Founded: 2012, San Francisco. Reach: Hundreds of properties in 19 countries. Features: Duetto offers a cloud-based revenue management system that integrates real-time data, enabling dynamic pricing and personalized rate recommendations. It focuses on improving RevPAR by providing hoteliers with actionable insights based on demand forecasts, competitive pricing analysis, and customer behavior.
iRates: Founded: San Diego. Client Base: Approximately 100 clients. Features: iRates is known for its user-friendly interface and automation capabilities. It allows hoteliers to streamline revenue management processes with minimal manual input, making it particularly attractive to small and mid-sized properties. The software emphasizes simplicity while still offering powerful forecasting and pricing tools.
Pricematch. Client Base: 800 hotels. Features: Pricematch focuses on optimizing pricing strategies through a combination of machine learning and data analytics. It helps hoteliers adjust room rates dynamically based on real-time market conditions, ensuring that they remain competitive while maximizing revenue.
Rainmaker. Specialization: Hotel gaming companies. Features: Rainmaker offers a suite of revenue management solutions tailored to the unique needs of hotels within the gaming industry. Its tools are designed to handle the complexities of large-scale properties, integrating gaming data with traditional hotel metrics to optimize both gaming and non-gaming revenue streams.
Deterministic Model: To maximize revenue by forecasting the optimal quantity of rooms to sell and the price to set at a specific moment. This model assumes that all variables are known with certainty and that the environment does not change during the period of analysis. Game theory and Decision Tree based on Bayes theorem are used
Dynamic Model: Extend the analysis over a longer period, taking into account the evolving nature of the market. These models recognize that factors such as demand, pricing, and competition are not static but change over time. As a result, they use historical data and elasticity measures to forecast how these variables will interact in the future
Review Questions
- Draw graphs to maximize the payoffs of the two parties through game theory using Nash equilibrium.
- Draw graphs to maximize the payoffs of the two options of one party through substitute and income effects using partial derivatives (elasticity)
- Draw graphs to obtain one scenario using overlapping for forecasted demand.
